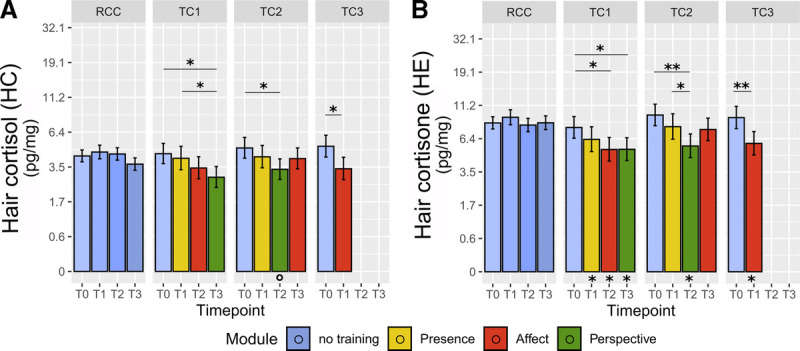
FIGURE 4.

Training effects on HC and HE in baseline-matched analysis. Estimated HC (A) and HE (B) levels were derived from LMM analysis in a sample of participants with matched baseline HC and HE levels across cohorts, generated based on the study participant pool. Participants from each TC were matched to RCC participants with replacement depending on their baseline glucocorticoid levels and sex. Note the natural log scale on the y-axis. Error bars represent ±1 SE. Asterisks below bars indicate comparison with RCC at the matched time point. *Significant at p ≤ .05. **Significant at p ≤ .01. ***Significant at p ≤ .001. HC = hair cortisol; HE = hair cortisone; SE = standard error; RCC = retest control cohort; TC = training cohort. Color image is available online only at www.psychosomaticmedicine.org.
