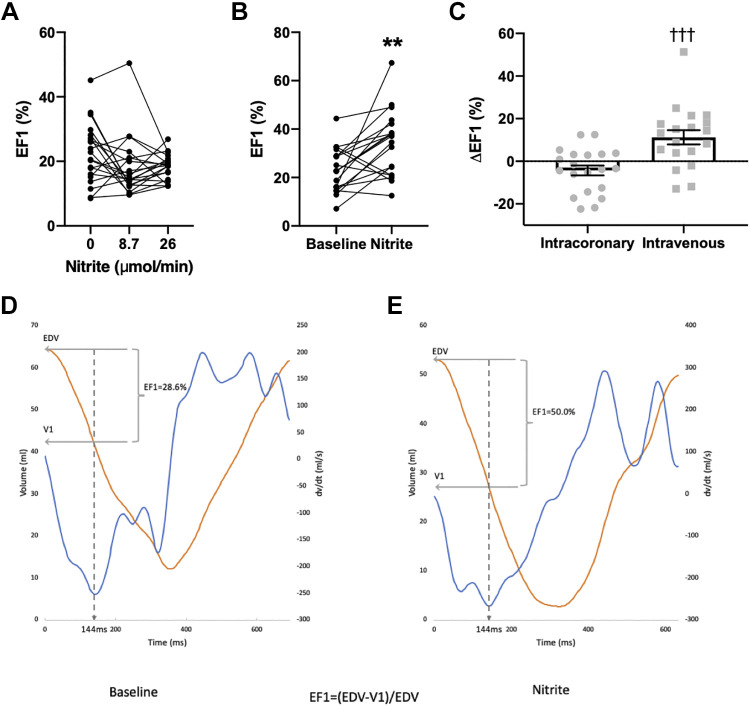
Figure 5.
The effect of nitrite on EF1. A: intracoronary nitrite (n = 20). B: intravenous nitrite (n = 19). C: comparison of peak change after intracoronary vs. intravenous nitrite. D: representative baseline trace of left ventricular (LV) volume (orange) and dP/dtmax (blue) with EF1 calculation demonstrated. E: representative trace of LV volume (orange) and dP/dtmax (blue) following intravenous nitrite with EF1 calculation demonstrated. **P < 0.01 vs. baseline, †††P < 0.001 vs. intracoronary nitrite by Student’s t test.

