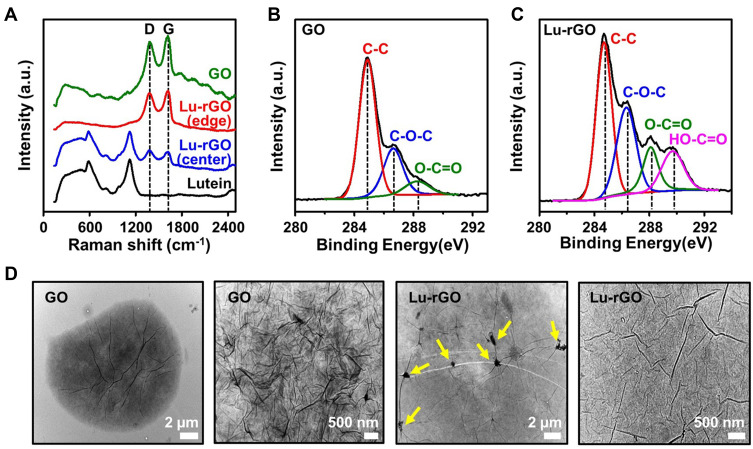
Figure 4.
(A) Raman spectra of lutein, GO, and the Lu–rGO complex. (B and C) Chemical component survey by XPS spectra (C1s) for the analysis of the functional group fractions and the changes of the surface state from GO to the Lu–rGO complex. (D) Highly magnified morphological features of GO and the Lu–rGO complex measured by TEM; the yellow arrows indicate spontaneously formed nanowrinkled nanostructures over the lutein-covered rGO surface.
Abbreviations: XPS, X-ray photoelectron spectroscopy; TEM, transmission electron microscopy.

