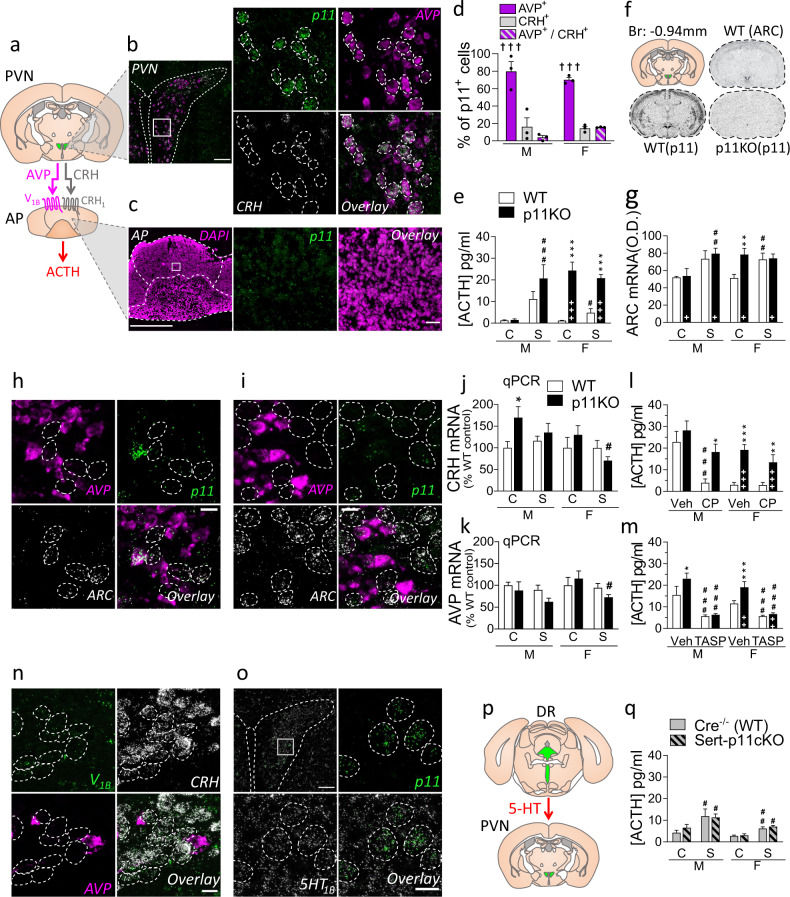
Fig. 2. p11 induced changes in the HPA axis.
a Arginine-vasopressin (AVP) and corticotropin-releasing hormone (CRH) are released from the paraventricular nucleus (PVN) of the hypothalamus, through the hypophyseal portal system into the anterior pituitary (AP), where they activate V1B and CRH1 receptors, respectively, to induce adrenocorticotropic hormone (ACTH) release. b Fluorescent in situ hybridization (FISH) images in the PVN show that p11 transcripts (green) are strongly expressed in the PVN, and overlap with AVP mRNA (magenta), but not CRH mRNA (white). Scale bars: 100 µm on the left, 15 µm on the right. Dashed line: p11 and AVP co-expressing cells. c In the AP, where cell bodies are stained with DAPI (magenta), FISH shows very low p11 expression (green). Scale bars: 500 µm on the left, 30 µm on the right. d The percentage of p11 expressing cells (p11+) that co-express AVP (AVP+) was significantly higher (p < 0.001, F(2,12) = 62.33) than those co-expressing CRH (CRH+), or both AVP and CRH (AVP+/CRH+). Two-way ANOVA showed no significant sex difference in the co-expression ratios. e Serum concentrations of ACTH were measured at baseline (C) or 1 min post-stress (S), in male (M) and female (F) p11KO and corresponding WT mice. In p11KO females, there is a sizable hypersecretion of ACTH (p < 0.0001, F(1,33) = 116.38) at baseline and 1 min post-stress compared to WT. Male p11KO mice showed higher but not statistically significant post-stress ACTH than WT. f Representative in situ autoradiograms at −0.94 mm from bregma with antisense p11 and ARC probes. The diagram in the top left delineates the PVN (green), from which optical density values (corrected for background) were measured. The top right autoradiogram is representative of ARC mRNA, taken from WT mice and illustrates the expression of this gene in the PVN. The bottom autoradiograms show the WT expression of p11 mRNA, and the corresponding section in a p11KO mouse. g Quantitative measurements of ARC gene expression at baseline (C) or 15 min post-stress (S) were performed by radioactive in-situ hybridization. There was a significant overall genotype (p < 0.05, F(1,31) = 4.5) and group (p < 0.001, F(1,31) = 17.6) difference. FISH images in the PVN of WT (h), and p11KO (i) unstressed females showing that ARC (white) mRNA is not co-expressed in cells positive for AVP (magenta) and p11 (green). Scale bars: 15 µm. Dashed line: ARC expressing cells. j CRH and k AVP mRNA abundance in the PVN was measured at baseline (C) or 1 min post-stress (S) by quantitative polymerase chain reaction (qPCR). For CRH mRNA, there was a significant overall sex difference (p < 0.05, F(1,58) = 4.92) and a genotype × stress interaction (p < 0.05, F(1,58) = 4.39). For AVP mRNA, there was only a significant overall stress difference (p < 0.05, F(1,58) = 5.36). Levels of ACTH 1 min post-swim stress, measured 30 min following injection of vehicle (Veh) and l CRH1 receptor antagonist CP 154,526 (CP, 30 mg/kg, i.p.); or m V1B antagonist, TASP 0390325 (TASP, 3 mg/kg, i.p.). l In males, CP could reduce ACTH in WT but not in p11KO mice (p < 0.0001, F(1,25) = 22.51); In females, there was a genotype difference (p < 0.0001, F(1,25) = 30.44), but CP did not significantly lower ACTH in WT females as Veh-treated levels in this cohort were low. m TASP could significantly reduce both male (p < 0.0001, F(1,31) = 35.82) and female (p < 0.0001, F(1,32) = 51.10) ACTH in both genotypes. Females also show significant effects of genotype (p < 0.01, F(1,32) = 11.01) and genotype × treatment (p < 0.05, F(1,32) = 6.57). n FISH images in the PVN show that V1B receptor transcripts (green) are present in CRH positive (white), but not AVP positive (magenta) cells. Scale bar: 15 µm. Dashed line: CRH-expressing cells. o FISH from PVN showing that 5-HT1B receptor transcripts (white) are widely expressed in the PVN, where they colocalize with p11 transcripts (green). Scale bars: 100 µm on the left, 15 µm on the right. Dashed line: p11 and 5-HT1B co-expressing cells. p The PVN receives serotonergic innervation from the dorsal raphe (DR). q Levels of ACTH in SERT-p11cKO were not significantly different from WT. There was only a significant effect of stress (Males: p < 0.01, F(1,44) = 9.58; Females: p < 0.0001, F(1,31) = 31.40). All data represent mean ± SEM. +p < 0.05, ++p < 0.01, +++p < 0.001 overall genotype difference; †††p < 0.0001, versus CRH+ and AVP+/CRH+ (d); *p < 0.05, **p < 0.01, ***p < 0.001, versus corresponding WT; #p < 0.05, ##p < 0.01, ###p < 0.001, versus baseline (e, g, j–k, q) or versus vehicle (l, m) within genotype; calculated with a three-way ANOVA followed by Fisher’s LSD test. Two-way ANOVA were performed for each sex in e, l, m, q, given that sexual differences in ACTH are a well-known fact.

