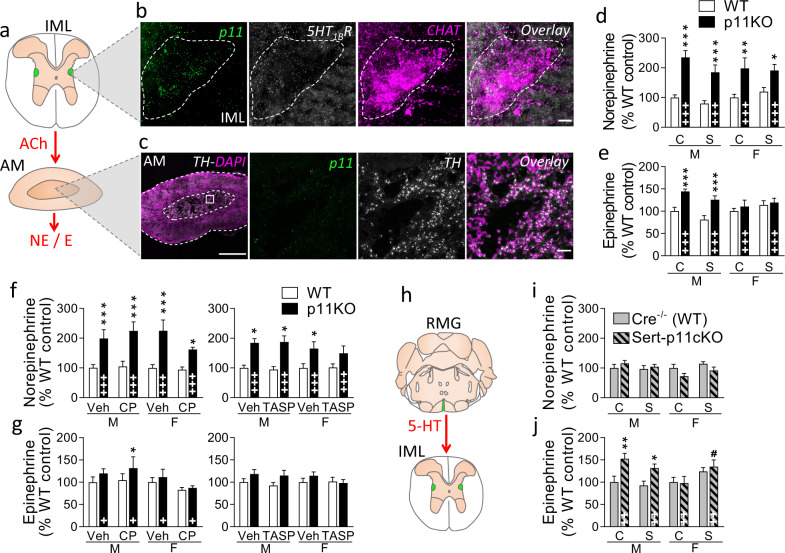
Fig. 3. p11 induced changes in the SAM axis.
a Preganglionic sympathetic neurons from the intermediolateral nucleus (IML) of the thoraco–lumbar spinal cord project to the adrenal medulla (AM), where they release acetylcholine (ACh), which regulates norepinephrine (NE) and epinephrine (E) levels. b Fluorescent in situ hybridization (FISH) images of the IML show that p11 transcripts (green) are strongly present in choline acetyltransferase (ChAT) expressing neurons (magenta) and overlap with 5-HT1B mRNA (white). Scale bars: 15 µm. Dashed line: p11, 5-HT1B, and ChAT co-expressing neurons. c In the AM, where cell bodies are stained with DAPI (magenta), FISH shows no expression of p11 (green) in tyrosine hydroxylase (TH) expressing neurons (white). Scale bars: 500 µm on the left, 30 µm on the right. Adrenal levels of d norepinephrine and e epinephrine were measured by HPLC at baseline (C) or 1 min post-stress (S), in male (M) and female (F) p11KO and corresponding WT mice. Both catecholamines were more abundant in p11KO compared to WT mice under baseline conditions. There was a significant overall genotype difference in adrenal norepinephrine (d) and epinephrine (e) (p < 0.0001, F(1,62) = 42.38 and p < 0.001, F(1,62) = 14,97, respectively). For epinephrine there was a significant genotype × sex interaction (p < 0.05, F(1,62) = 6,44). 1 min post-stress levels of adrenal f norepinephrine and g epinephrine, measured 30 min following injection of vehicle (Veh) and CRH1 receptor antagonist CP 154,526 (CP, 30 mg/kg, i.p.); or V1B antagonist, TASP 0390325 (TASP, 3 mg/kg, i.p.). There were no significant differences in norepinephrine or epinephrine levels following either antagonist. There were significantly higher noradrenaline (f) levels in p11KO compared to WT mice (p < 0.0001, F(1,52) = 40.99, left graph; p < 0.001, F(1,62) = 15.47, right graph). Genotype differences in epinephrine (g) levels were statistically significant in one of the cohorts (p < 0.05, F(1,51) = 6.60, left graph), where there was also a sex difference (p < 0.05, F(1,51) = 5.78, left graph). h Serotonergic neurons from the raphe magnus (RMG), where p11 is highly expressed, project to the IML. Levels of adrenal i norepinephrine and j epinephrine, at baseline (C) or 1 min post-stress (S), in male (M) and female (F) SERT-p11cKO and corresponding WT mice (Cre−/−). In SERT-p11cKO, there were no significant effects for norepinephrine (i), while for epinephrine (j) there were effects of genotype (p < 0.0001, F(1,59) = 17.62), genotype × sex (p < 0.01, F(1,59) = 8.92) and stress × sex interaction (p < 0.01, F(1,59) = 7.30). Data are shown as the mean ± SEM. +p < 0.05, ++p < 0.01, +++p < 0.001 overall genotype difference; *p < 0.05, **p < 0.01, ***p < 0.001, versus corresponding WT; #p < 0.05, versus baseline; calculated with a three-way ANOVA followed by Fisher’s LSD test.

