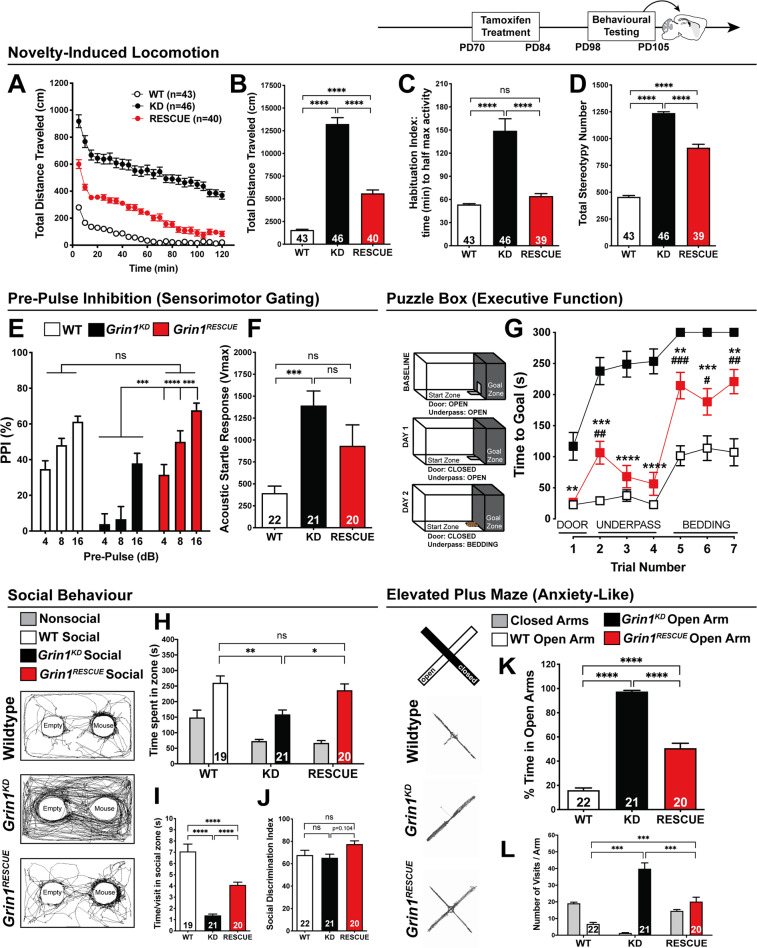
Fig. 4. Cognitive function rescued with adult intervention, while other behaviours show intermediate improvement.
All behaviours were measured in WT, Grin1KD, and Grin1RESCUE mice starting at PD98. a Time course and b total distance travelled (cm) in open field (OF) test. One-way ANOVA (total, effect of genotype F2,126 = 156.3, p < 0.0001), Bonferroni post hoc. c Habituation index (time to reach half maximal activity) in OF test. One-way ANOVA, effect of genotype, F2,125 = 29.38, p < 0.0001, Bonferroni post hoc. d Stereotypy number in OF test. One-way ANOVA, effect of genotype, F2,126 = 382.7, p < 0.0001, Bonferroni post hoc. e Percent inhibition of startle response (pre-pulse inhibition, PPI). Shown on graph, Grin1KD vs. Grin1RESCUE, two-way ANOVA, effect of genotype—F2,60 = 16.65, p < 0.0001; genotype × decibel—F4,120 = 3.526, p = 0.0093, Bonferroni post hoc. f Acoustic startle response (ASR). One-way ANOVA, effect of genotype, F2,60 = 8.913, p = 0.0004, Bonferroni post hoc. g Time to reach goal zone (seconds; max 300 s) measured in puzzle box paradigm. Shown on graph, #WT vs. Grin1RESCUE; *Grin1KD vs. Grin1RESCUE. Two-way ANOVA, effect of genotype: F2,64 = 66.98, p < 0.0001, Bonferroni post hoc. n values: WT—21, Grin1KD—25, Grin1RESCUE—21. h Total time spent, i time per visit and j social discrimination index in zones during 10 min modified three chamber social test. One-way ANCOVA, there is an effect of genotype after controlling for locomotor activity: (time in social zone) F2,59 = 4.707, p = 0.013, (time/visit) F2,59 = 4.424, p = 0.016, (discrimination index) F2,59 = 3.161, p = 0.050, Bonferroni post hoc. k % time spent in open arms and l number of visits per arm in the elevated plus maze (EPM). One-way ANCOVA, there is an effect of genotype after controlling for locomotor activity: (% time spent in open arms) F2,59 = 280.024, p < 0.001, (number of visits in the open arm) F2,59 = 134.631, p < 0.001, Bonferroni post hoc. All data shown as mean ± SEM, *p < 0.05; **p < 0.01; ***p < 0.001; ****p < 0.0001, ns not significant.

