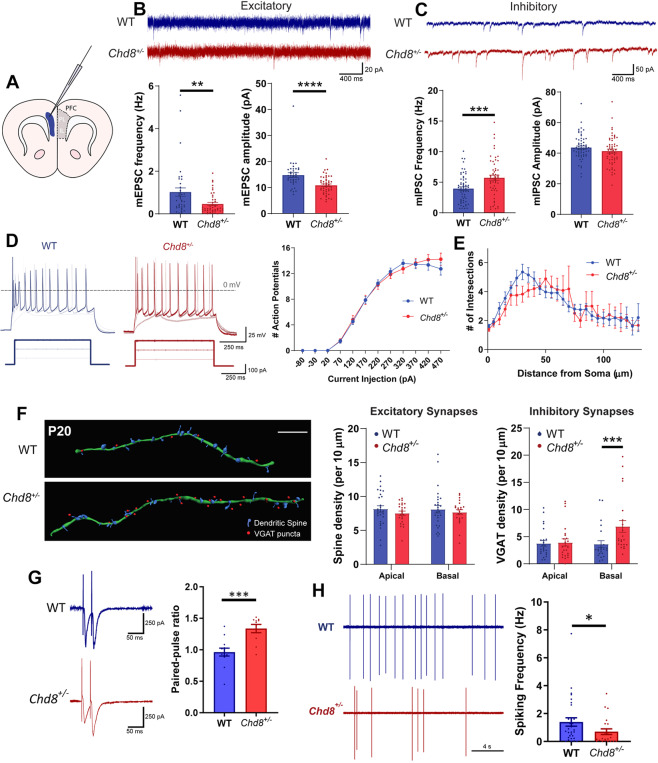
Fig. 1. Reduced synaptic E:I balance in the PFC of Chd8+/– mice.
A Schematic illustrating coronal ex vivo brain slice, blue shading indicates recording area in layers V/VI of the PFC. IL infralimbic cortex, PL prelimbic cortex. B, C Representative mEPSC (B) and mIPSC (C) recordings from pyramidal neurons from P19–21 WT (blue) and Chd8+/– (red) animals alongside quantifications of mEPSC and mIPSC frequency (bottom left graphs) and amplitude (bottom right graphs). B Chd8+/– neurons display significantly reduced mEPSC frequency (p = 0.0027) and amplitude (p < 0.0001) but C increased mIPSC frequency (p = 0.0009) and equivalent mIPSC amplitude. D Normal action potential (AP) firing frequency in Chd8+/– neurons; left: representative voltage traces and current injection stimuli (below), right: f-I curves. E Sholl analysis of basal dendrites (P22) shows no significant difference in Chd8+/– neurons. F Analysis of synapse densities at P20; left: representative reconstructions of secondary basal dendrites (green filament) with associated spines (blue) and inhibitory synapses (red dots) from WT (above) and Chd8+/– (below) GFP+ pyramidal neurons immunolabeled for the inhibitory synapse marker VGAT (scale bar 10 µm), with quantifications of spine (middle) and VGAT (right) densities. Chd8+/– neurons showed no difference in spine densities, nor in VGAT density on apical dendrites, but did show an increase in VGAT density on basal dendrites (p = 0.0002). G Representative PPR recordings (left) from WT and Chd8+/– PFC neurons; quantification (right) shows elevated PPR in Chd8+/– neurons. H Reduced spontaneous AP firing in Chd8+/– neurons, representative traces (left) and quantification (right). For all figures, bars show mean, error bars SEM, *p < 0.05, **p < 0.01, ***p < 0.001, ****p < 0.0001.

