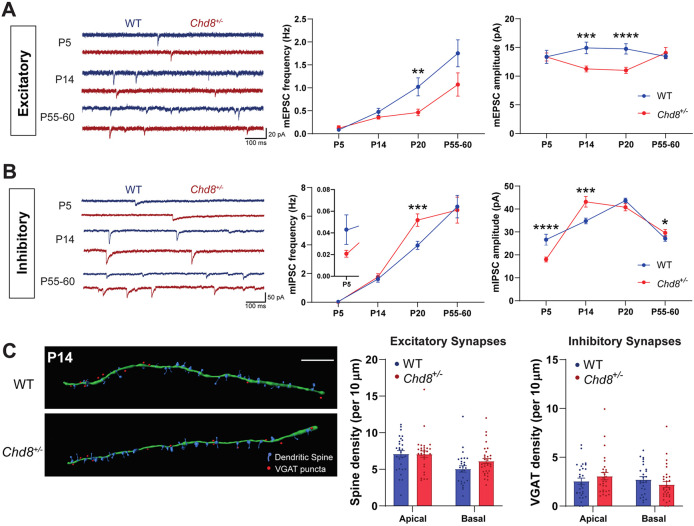
Fig. 2. Developmental stage-specific synaptic effects of Chd8 heterozygosity.
A, B Developmental trajectory of excitatory (A) and inhibitory (B) synaptic function; left: representative mEPSC (A) and mIPSC (B) recordings from PFC neurons in ex vivo slices from P5, P14, and P55–60 WT (blue) and Chd8+/– (red) animals: frequency (middle) and amplitude (right) changes during development. Chd8+/– neurons showed no significant difference in mEPSC frequency at P5, P14, and P55–60 nor in amplitude at P5 and P55–60 but did show decreased mEPSC amplitude at P14. Chd8+/– neurons showed no significant difference in mIPSC frequency at P5, P14, and P55–60, but displayed decreased mIPSC amplitude at P5 (p < 0.0001) followed by increased amplitude at P14 (p = 0.0008) and P55–60 (p = 0.033). C Analysis of synapse densities at P14; left: representative reconstructions of secondary basal dendrites (green filament) with associated spines (blue) and inhibitory synapses (red dots) from WT (above) and Chd8+/– (below) GFP+ pyramidal neurons immunolabeled for the inhibitory synapse marker VGAT (scale bar 10 µm), with quantifications of spine (middle) and VGAT (right) densities. At P14, Chd8+/– neurons showed no difference in either spine or inhibitory synapse densities. *p < 0.05, **p < 0.01, ***p < 0.001, ****p < 0.0001.

