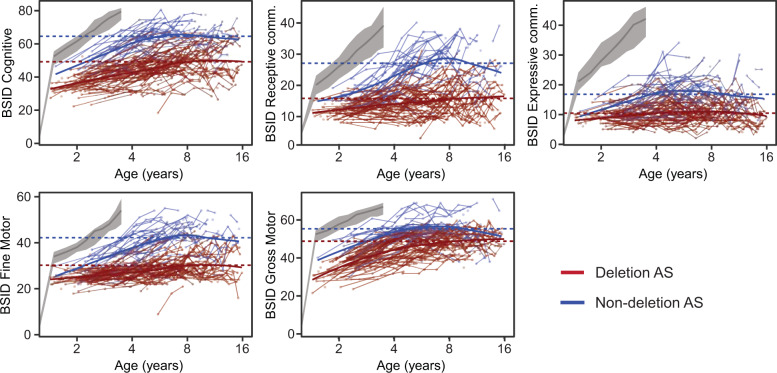
Fig. 2. Raw data from the five BSID-III scales as a function of age.
Gray bands indicate median scores and inter-quartile ranges from a typically developing sample (data from the scale manuals, available for up to 3.5 years of age). Values from the same participant are connected by thin lines. Thick lines are the LOESS smoothing curves for deletion (blue) and non-deletion (red) participants. Dotted horizontal lines are the overall group means. Note that these curves are cross-sectional data summaries, i.e., they do not account for within-subject longitudinal effects and are used for qualitative inspection of the developmental trajectory.

