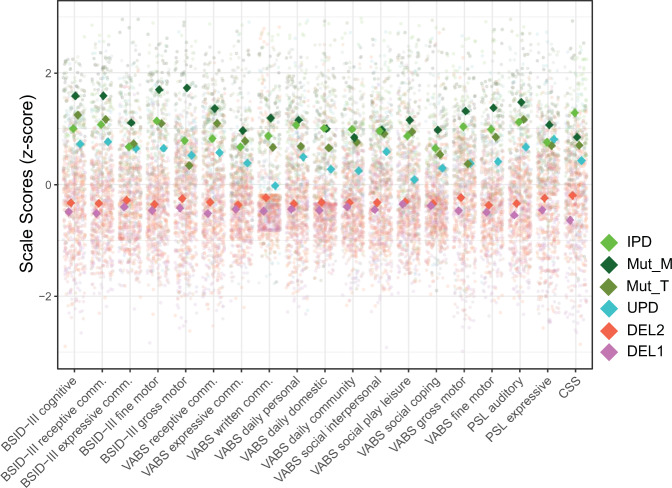
Fig. 3. Comparisons of scores for different genotypes for mean log age.
Z-standardized data from all participants and visits with the; data projected to mean of log2 age (5.8 years), derived from the respective “winning model” (see Patients and Methods). See Supplementary Fig. 4 for mean ± 1 SD around the mean log age (i.e., 3.2 and 10.7 years, respectively). This Fig. (and Supplementary Fig. 4) serves illustrative purposes and indicates the directionality of effects, statistical analyses are provided in Tables 1,2, and Supplementary Tables 5, 6, 10. CSS values have been inverted, such that higher values reflect higher performance.

