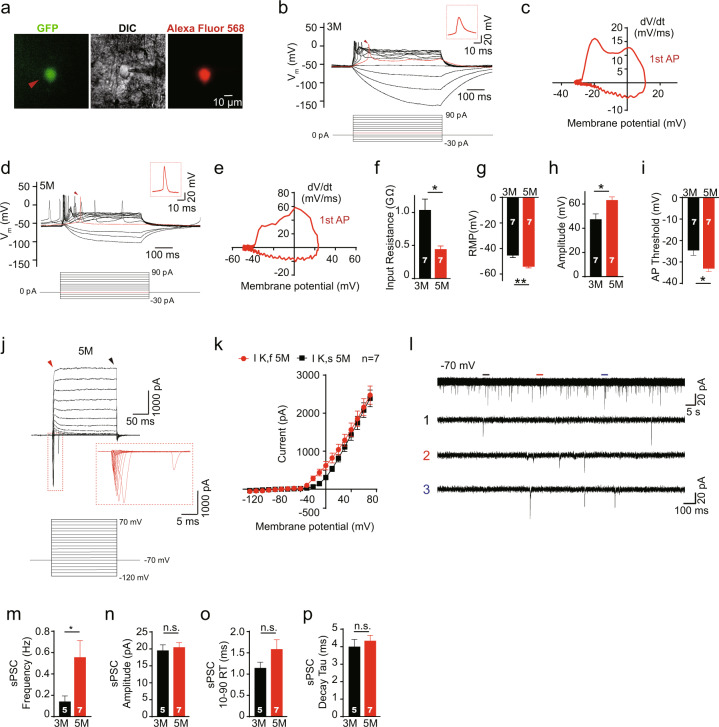
Fig. 3. Grafted neurons display electrophysiological characteristics of mature neurons.
a Representative images of a recorded EGFP-expressing neuron at 5 months after transplantation. The EGFP+ cell (left, red arrowhead) was recorded in the whole-cell configuration guided by DIC microscopy (middle) and then filled with Alexa Fluor 568 dye (right). b Representative traces showing the changes in the membrane voltage of an EGFP-expressing neuron in response to a series of step current injections at 3 months after transplantation. Note that the highlighted traces (red, upper traces) show the first action potential generated in response to a 10-pA injection (red, lower traces). c A phase plot of the I–V relationship of the EGFP-expressing neuron in (b). d, e Same as (b) and (c), but at 5 months posttransplantation. Note that the first AP was generated by a 0-pA injection (red arrowhead). The boxed insets in (b) and (d) show the expansion of the first AP (arrowhead) on an enlarged scale. f, i Summary of the input resistance (f), resting membrane potential (RMP) (g), action potential peak amplitude (h), and threshold (i) of EGFP-expressing neurons at 3 months and 5 months after transplantation. *p < 0.05; **p < 0.005, Student’s t test. j Representative traces of Na+ and K+ currents evoked in EGFP-expressing neurons from −120 to 70 mV in 10-mV steps at 5 months posttransplantation. The boxed inset shows the expansion of Na+ currents on an enlarged scale. The red arrowhead indicates the fast component of the K+ currents (IK, f), and the black arrowhead indicates the slow component of K+ currents (IK, s). k The I–V plot of averaged outward currents corresponding to (j). l Sample traces of spontaneous postsynaptic currents (sPSCs) at a holding potential of −70 mV from an EGFP-expressing neuron at 5 months after transplantation. The bottom three traces are expanded from the top traces drawn with thick lines. m–p Summary of the frequency (n), amplitude (o), rise time (p), and decay time (q) of sPSCs recorded at a holding potential of −70 mV from neurons at 3 months or at 5 months after transplantation. *p < 0.05, Student’s t test. The data are presented as the mean ± SEM. N indicates the number of neurons recorded.

