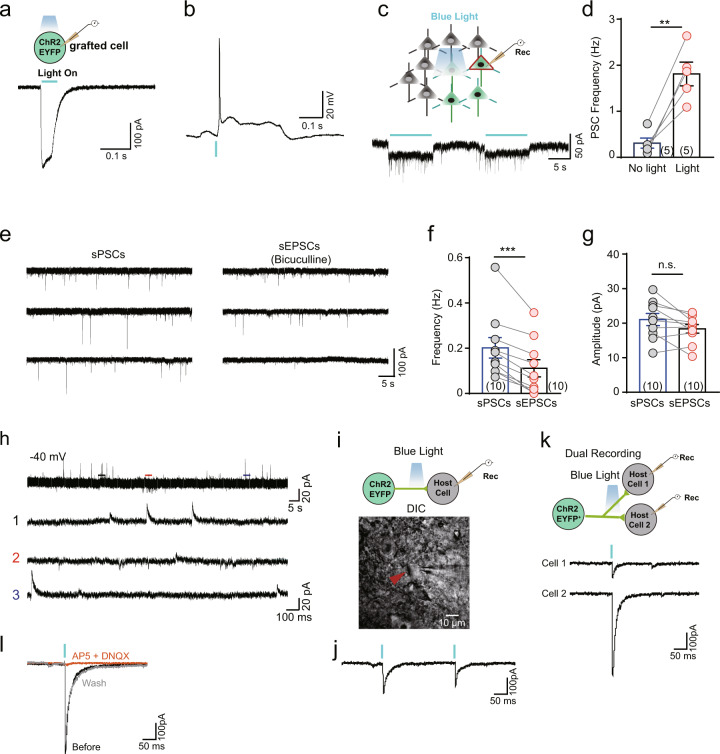
Fig. 4. Grafted human cerebral organoids expressing ChR2–EYFP are functionally integrated into synaptic circuits in the host mouse brain.
a Schematic of a whole-cell recording of a grafted cell at 5 months after transplantation (top) and ChR2-mediated currents elicited in the grafted cells by blue light illumination (bottom). b An action potential triggered in a grafted cell by activation of ChR2. c, d Photostimulation of grafted cells expressing ChR2 increased the frequency of postsynaptic currents (PSCs). Schematic of the experimental paradigm (c, top), a representative trace from a grafted cell, and quantification of sPSCs with light off and light on (c, bottom). **p < 0.01, Student’s t test. e Sample traces of spontaneous PSCs (left) and spontaneous excitatory postsynaptic currents (sEPSCs, right) recorded in a grafted cell (left) at 5 months after transplantation at a holding potential of −70 mV. sEPSCs were recorded in buffer containing bicuculline (10 µM, right). f, g Quantification of the frequency (f) and amplitude (g) of sPSCs and sEPSCs from ChR2-expressing neurons at 5 months after transplantation. ***p < 0.001, Student’s t test. h Sample traces of spontaneous postsynaptic currents (sPSCs) at a holding potential of −40 mV from an EYFP-expressing neuron at 5 months after transplantation. The bottom three traces are expansions of the areas of the top traces drawn with thick lines. i Schematic of the experimental paradigm and a DIC image of a recorded host cell in the cortex. Photostimulation activated ChR2-expressing neurons that generated excitatory postsynaptic currents in a recorded EYFP-negative host cell. j Sample trace of two PSCs elicited in a host cell by paired pulses of light stimulation at a holding potential of −70 mV. k Dual recordings showing PSCs simultaneously evoked in a pair of host cells in response to photostimulation. l Sample trace of light-evoked PSCs recorded in a host cell before (black) and after (orange) application and after washout (gray) of AP5 (50 μM) and DNQX (10 μM), which block ionotropic glutamatergic receptors. The data are presented as the mean ± SEM. N indicates the number of neurons recorded.

