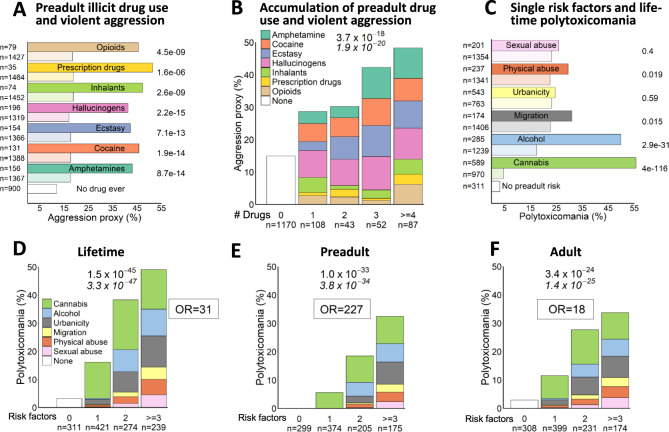
Fig. 1. Environmental influence on behavioral phenotypes.
A Associations of preadult illicit drug use with violent aggressive behavior as measured by an aggression proxy (developed in Mitjans et al. [16]). Columns in dark colors denote preadult users of the respective drug; light colors indicate non-users of this specific drug. Note that drug use shown is not exclusive, i.e., a person that consumed opioids might also have used inhalants and thus appear in both columns as user; a person that used cocaine but not ecstasy will appear as non-user for ecstasy. Group “No drug ever” refers to lifetime non-consumption of any illicit drug. Left side: N numbers. Right side: P values (Chi²-test, two-sided) comparing users and non-users. Note that in this panel, cannabis, alcohol, nicotine and caffeine are not considered. B Step-wise increase in aggression proxy with the number of drug classes used in early life. Colors in bars represent respective drug classes. C Associations of single preadult environmental risk factors and lifetime polytoxicomania. Columns in dark colors denote individuals exposed to respective risk factor, light colors refer to individuals not exposed to this specific risk (not necessarily devoid of any risk at all). Note that risks shown are not exclusive, i.e., many individuals carry more than 1 risk factor. D–F Accumulation of preadult environmental risk factors leads to stepwise increase in lifetime polytoxicomania (D), exclusive preadult polytoxicomania (E) and polytoxicomania appearing exclusively later in life (F). Colors indicate respective risk factors (B), (D–F): n numbers below bars, (A), (B) on left side. Chi²-test p values (two-sided) on top of graph (B), (D–F) or right side (A), (B); Cochran–Armitage test p values (two-sided) (B, C), (E) underneath in italics. OR: Odds Ratio.

