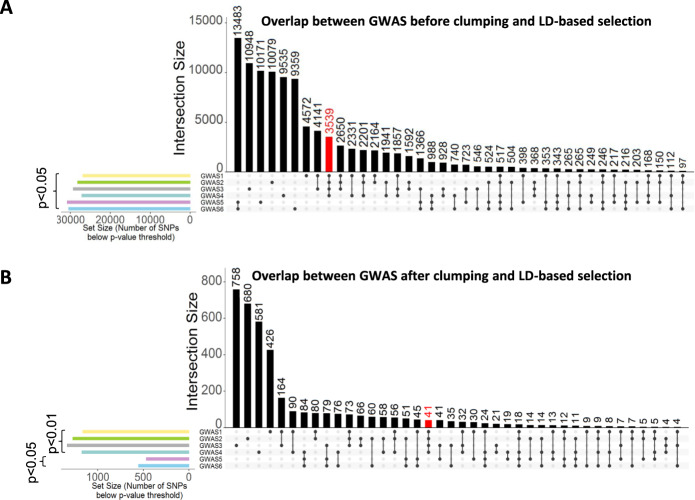
Fig. 4. Intersection of SNP results before and after clumping.
A Intersection raw results before clumping of associated SNPs from all 6 GWAS. Black bars represent the number of intersecting SNPs below p value threshold 0.05. Dots indicate the respective GWAS for which the number of intersecting SNPs was calculated. Columns with single dots indicate SNPs unique to the corresponding GWAS. GWAS 1-4 and GWAS 5-6 show strong overlap within each other. Importantly, as indicated by the red bar, the largest intersection size when overlapping 4 GWAS is between GWAS 1-4 (polytoxicomania and/or schizophrenia GWAS). These SNPs show no association in GWAS 5-6. The novel approach applied to raw GWAS results would thus yield 3539 SNPs. Colored bars on the left indicate the number of associated SNPs per individual GWAS, i.e., the set size. B Intersections of associated SNPs from all 6 GWAS building on clumped SNP results and considering LD linkage neighbor signals. Black bars represent the number of intersecting SNPs below the given p value threshold on the left. Dots indicate the respective GWAS for which the number of intersecting SNPs was calculated. Columns with single dots indicate SNPs unique to the corresponding GWAS. Again, the intersection of SNPs associated in GWAS 1-4, but not GWAS 5-6, is larger than for any other combinations of 4 GWAS and yields now a strongly reduced set of 41 polytoxicomania-associated SNPs (red bar). Colored bars on the left indicate the number of associated SNPs per individual GWAS, i.e., the set size.

