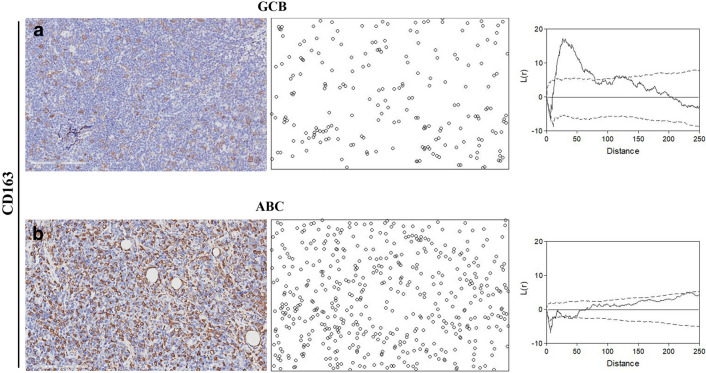
Fig. 3.
Spatial statistics-based analysis of the cell patterns from CD163-stained samples. Representative cell patterns from GCB in a and ABC in b tissue samples. Microscope images (left panel) are shown together with the corresponding pattern of positive cells (middle panel). In the right panel, the function L(d) = K(d)–K0(d) (see text) is plotted together with the upper- and lower-95% confidence interval envelopes for a random distribution (dashed lines). As shown, the L-function indicates that the CD163-positive cell pattern from GCB does not uniformly fill the tissue space but appears significantly aggregated since the L-function is outside the superior limit for a random point process for a quite large interval of cell-to-cell distances. On the contrary, the CD163-positive cell pattern from ABC does not differ significantly from a random spatial distribution

