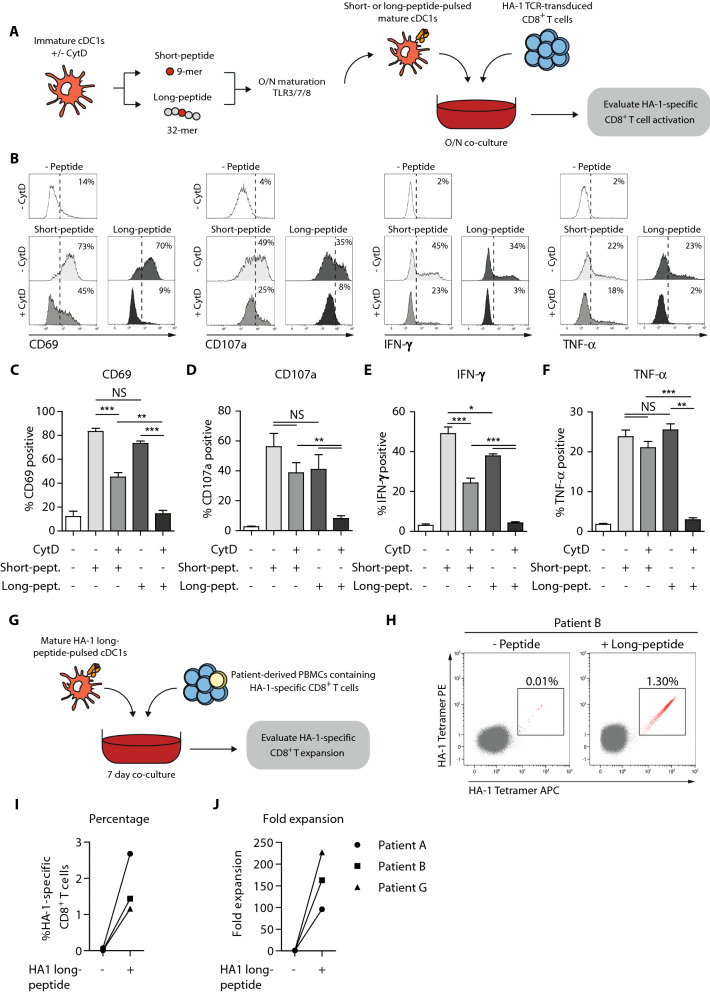
Fig. 5.
Ex vivo-generated cDC1s superiorly cross-present tumor antigens and activate HA-1-reactive T cells. a Schematic overview of antigen cross-presentation assay with HA-1 TCR-transduced T cells. Immature ex vivo-generated cDC1s and cDC2s were treated with/without CytD for 1 h, followed by 2 h incubation with either short- or long HA-1 peptide, whereupon overnight maturation is induced. Subsequently, mature ex vivo-generated peptide-pulsed cDC1s and cDC2s were overnight co-cultured with HA-1 TCR-transduced CD8+ T cells, whereupon T cell activation is evaluated using flow cytometry. b–f Representative histograms (b) and graphs (c–f) showing CD69 expression on T cells (b, c), T cell degranulation (CD107a expression)(b,d), and IFN-γ- (b, e) and TNF-α (b, f) production by T cells induced by short or long-peptide-pulsed (CytD treated) cDC1s. Data is shown as mean ± SEM (n = 3). g Schematic overview of antigen cross-presentation assay with patient-derived PBMCs. Mature ex vivo-generated long-peptide-pulsed cDC1s were co-cultured with alloSCT patient-derived PBMCs containing low frequencies of HA-1 specific CD8+ memory T cells. After 7 days of co-culture, HA-1 specific CD8+ T cell expansion was assessed using tetramer-based flow cytometry. h Representative dot plots in which numbers indicate the frequency of HA-1 specific CD8+ T cells. i–j Frequencies and absolute numbers of HA-1 CD8+ T cells of three different patients. Patient characteristics are shown in supplementary table S1. Statistical analysis was performed using unpaired T test (b, c) or repeated measures one-way ANOVA followed by Bonferroni post-hoc test (e–h). ***P < 0.001, **P < 0.01, *P < 0.05. CytD, cytochalasin D; TCR, T cell receptor; NS, non-significant; SEM, standard error of the mean

