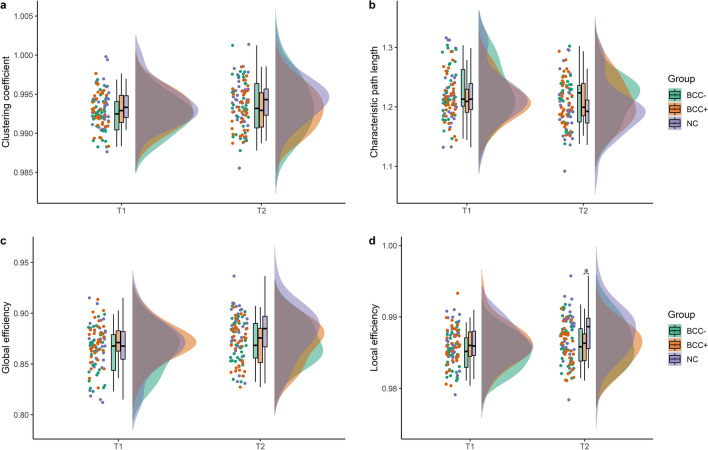
Fig. 2.
Graph measure values of participants at T1 and T2. These values represent values after normalization by random networks. A Clustering coefficient (Cp) values of participants B Characteristic path length (Lp) of participants C Global efficiency (Eglob) values at T1 and T2 D Local efficiency (Eloc) of participants at T1 and T2. NC non-cancer control, BCC − breast cancer patients without chemotherapy, BCC + breast cancer patients with chemotherapy. *Statistically significant difference defined as p < 0.05

