

Abstract
Folklore is the collection of traditional beliefs, customs, and stories of a community passed through the generations by word of mouth. We introduce to economics a unique catalog of oral traditions spanning approximately 1,000 societies. After validating the catalog’s content by showing that the groups’ motifs reflect known geographic and social attributes, we present two sets of applications. First, we illustrate how to fill in the gaps and expand upon a group’s ethnographic record, focusing on political complexity, high gods, and trade. Second, we discuss how machine learning and human classification methods can help shed light on cultural traits, using gender roles, attitudes toward risk, and trust as examples. Societies with tales portraying men as dominant and women as submissive tend to relegate their women to subordinate positions in their communities, both historically and today. More risk-averse and less entrepreneurial people grew up listening to stories wherein competitions and challenges are more likely to be harmful than beneficial. Communities with low tolerance toward antisocial behavior, captured by the prevalence of tricksters being punished, are more trusting and prosperous today. These patterns hold across groups, countries, and second-generation immigrants. Overall, the results highlight the significance of folklore in cultural economics, calling for additional applications.
I. Introduction
Two broad observations motivate our study. First, narratives are central building blocks of our societies. We think in stories and explain the world by telling stories. Harari (2015), for example, identifies in the myths present in people’s collective imagination the roots of their successes and failures. Despite their central role in connecting actions to values and needs, economists have only recently turned to the study of narratives (e.g., Akerlof and Snower 2016; Shiller 2017).1
Second, during the past two decades, a burgeoning body of work exploring the cultural, historical, and institutional roots of comparative development highlights the significance of ethnic, linguistic, and religious groups (Michalopoulos and Papaioannou 2017; Nunn 2020). Much of this research, however, relies on valuable but incomplete ethnographic sources including the widely used Ethnographic Atlas (EA). Furthermore, the absence of proxies of historical norms renders inquiries into how attitudes change and why they persist intractable.2 Other weaknesses of the EA, the celebrated compilation of George Peter Murdock (1967), concern the uneven coverage of groups and attributes and measurement error.
In this study, we leverage a group’s oral tradition to shed light on its cultural heritage and past social and economic structures. According to the Oxford Dictionary, folklore consists of the traditional beliefs, customs, and stories of a community, passed through the generations by word of mouth. This corpus is the subject of the discipline of folklore. We do three things to reveal the potential of integrating traditional narratives in the toolset of economists and political scientists interested in the origins of comparative development, gender norms, morality, psychology, and culture.
First, we introduce to economics a catalog of folklore that codes the distribution of thousands of motifs across 958 world societies. This database is the lifetime work of eminent anthropologist and folklorist Yuri Berezkin. A motif, according to the author, is an episode or an image found in the set of narratives recorded in an ethnolinguistic community. We validate the catalog’s content by establishing that images and episodes in a group’s oral tradition reflect salient features of its physical environment. For example, groups closer to earthquake-prone regions have a higher incidence of earthquake-related motifs, groups on fertile land have more crop-related images, and groups living close to rivers (or in colder climates) have more episodes reflecting their respective landscapes. Then we link the groups in Berezkin’s collection to the EA and show that the folklore-based measures of political complexity, family structure, and subsistence mode robustly correspond to EA’s analogous traits.
Second, we illustrate how to use a group’s oral tradition to fill in gaps in the ethnographic record, focusing on the degree of political complexity and the presence of high gods. In addition, we show how one can use folklore to quantify the extent of the preindustrial market economy, a key economic aspect that the EA does not cover.
Third, we present a method to uncover a group’s cultural heritage that involves reading and classifying motifs by multiple individuals.3 We focus on trust, risk-taking, and gender norms to illustrate our approach. To capture trust, we look at how tricksters (a common archetype in oral traditions) are depicted in the motifs, distinguishing between cases where their deceiving behavior is successful or punished. Regarding risk-taking, we look at how challenges and competitions are portrayed, differentiating between tragedies and victories. To measure gender norms, we classify the various stereotypical roles males and females play in the motifs.
These folklore-based measures of historical attitudes are robust predictors of contemporary values and economic choices. Folks who grew up listening to stories where tricksters often fail to deceive their victims are more trusting and prosperous today. Groups with oral traditions rich with heroes who successfully tackle challenging situations tend to display more appetite for risk and appear more entrepreneurial. Societies whose folklore portrays women as less dominant, more submissive, and more likely to engage in domestic affairs than men tend to relegate their women to inferior roles in their communities, both historically and today. These patterns hold across countries, second-generation immigrants, and ethnic groups, suggesting that folklore may be one of the vehicles by which norms are intergenerationally transmitted.
We organize the article as follows. In Section II, we introduce and describe Berezkin's work. In Section III, we validate the catalog’s content using various checks. In Section IV, we use folklore to improve upon the ethnographic record. In Section V, we show how to quantify ancestral beliefs and attitudes from a group’s oral tradition. In Section VI, we offer some thoughts on future work.
II. Berezkin’s Folklore and Mythology Catalog
For the most part, folklorists limit their studies to small, well-defined collections with a regional focus (see El-Shamy 2004, for example, for a classification of folktales in the Arab world). Berezkin’s Folklore and Mythology Catalog is an exception, representing a global comparative perspective of oral traditions. In Online Appendix 1, we offer a brief overview of folklore studies. Berezkin has constructed a unique mythology and folklore database for 958 groups worldwide, initially cataloging motifs of indigenous societies in the Americas and later extending his classification to groups in the Old World. From the 958 world groups, he has categorized 2,564 motifs. A motif reflects a combination of images, episodes, or structural elements found in two or more texts, including sacred and profane ones (Berezkin 2015a). See Figure I for the spatial distribution of groups in Berezkin’s catalog.4
Figure I.

Groups in Berezkin’s Catalog
Berezkin is interested in understanding the historical spread of motifs across societies. His research explores the areal distribution of specific (sets of) motifs in relation to large-scale population movements, migrations, cultural contacts, and interactions in history and prehistory (see Berezkin 2015b and Berezkin and Duvakin 2016). To encode motifs, he consulted a list of 6,239 books ( ) and journal articles (
 ) from 4,041 authors, edited by 4,932 publishing houses in 32 different languages.5 For the average society, Berezkin consulted 15 publications from 12 authors, written in 3.5 different languages from 14 publishers. The bulk of materials appeared during the twentieth century with the earliest and usually the key publication for the median society dating back to 1904. The date of the earliest publication consulted per oral tradition is in Online Appendix Figure I. The most common languages are English, Russian, Spanish, German, French, and Portuguese (Online Appendix Table I, Panel A).
The median group in Berezkin has 62 motifs. See Figure II for a continent-specific histogram of the number of motifs across groups. Russians have the largest number of motifs, and one group, the Yeyi in northwestern Botswana, has only a single recorded motif. In Online Appendix Table I, Panel B, we report the top 10 societies in terms of motifs. There are two broad classifications of motifs, those describing adventures and tricks (roughly  ) and those related to cosmology and etiology.
Figure II.

Number of Motifs across Groups by Continent
The building blocks of our analysis are the motifs in Berezkin’s catalog. Some motifs appear to be universal, whereas others are only found in a handful of folklore traditions. The median motif spans 18 oral traditions. Online Appendix Figure II shows the histogram of the incidence of motifs across oral traditions. The most widespread motif, k27n, is titled “Tasks of the in-laws” and reads, “Father or other kinsmen of hero’s wife or bride try to kill or test him and/or suggest to him difficult tasks.” This theme can be found in 355 out of the 958 oral traditions spanning all continents; see Online Appendix Figure IIIa. Eleven motifs appear in exactly two oral traditions. For example, motif b107, found among the Heiltsuk in today’s British Columbia and the Flathead in western Montana, reads: “During a (world) fire, the oyster burns, so the oyster shells are black”; see Online Appendix Figure IIIb. In Online Appendix 2, we trace some of the original tales used to construct a common motif and describe the underlying sources of the Telugu oral tradition.
Each motif in Berezkin’s catalog is accompanied by a title and a short description of an image or an episode in the group’s oral tradition. Therefore, the underlying data are text.6 We use two approaches to quantify the aspects of folklore that we are interested in. The first one is a dictionary-based method that breaks down the text into words and connects word counts to the attributes we wish to measure. It is the simplest and most frequently used method.7 We use the related words from the word embeddings in ConceptNet for any keywords of interest. The second approach relies on the human classification of a motif’s content.
II.A. Caveats
There are several aspects of this database worth discussing. One natural question regards when the stories appeared in a given oral tradition. Folklorists are interested in collecting stories untouched by modernization, and collectors perceived narratives as having a precise origin in space and time. This idea has been criticized by Jason (1970) and Goldberg (1984) because of the inherent uncertainty in developing convincing estimates. Nevertheless, certain types of motifs likely pre-date others. For example, cosmological ones are considered significantly older than other types of motifs. In important work, Silva and Jamshid (2016) integrate insights from phylogenetic analysis of languages to establish that the tales of the Beauty and the Beast and Rumpelstiltskin originated sometime between 2,500 and 6,000 years ago. So it is useful to keep in mind that what appears in folklore images is potentially from a period long before the one captured by the EA.
Second, in his catalog, Berezkin (like all works in comparative mythology) does not code images found in a single oral tradition, but focuses on motifs shared by at least two groups. In Online Appendix 3, we shed some light on the magnitude of motif borrowing by looking at how the incidence of specific concepts in an oral tradition influences the frequency of such images in a neighboring group’s folklore.
Third, this catalog does not account for the popularity of a motif or the number of alternative versions of a particular tale. Instead, our folklore images simply reflect whether the motif exists in a society. How deeply a given oral tradition has been studied will naturally influence the number of variants recorded per tale. Focusing on whether a given motif is present may help mitigate concerns regarding differential sampling across societies.8 Similarly, we do not know the number of tales and legends in a given oral tradition because there is no one-to-one mapping between myths and motifs. One tale may map into multiple motifs and vice versa.
Fourth, the definition of a group in Berezkin’s catalog is usually along linguistic lines. Sometimes, he groups related societies when he does not have enough information.
Fifth, the number of stories recorded for a group is influenced by the degree to which that group was studied by folklorists. To address this issue, we often control for country-specific constants in our empirical analysis. By comparing oral traditions in the same country, we mitigate concerns related to the unbalanced coverage across countries in terms of the quality and breadth of the recorded oral traditions.9 Taking a step further, we control for the number of publications in a group’s folklore.
Sixth, there is substantial heterogeneity in folklore collection over time. Early folklorists were often missionaries or curious intellectuals, whereas later generations were frequently scholars, including anthropologists conducting fieldwork in small-scale societies. Differences in the timing of those being surveyed may reflect differences in the tastes, biases, and interests of the story collectors. To partially account for this, we control for the year of the earliest publication per oral tradition.10
Finally, Berezkin’s goal is to produce a catalog of images and episodes that appear in a given oral tradition. He does not attempt to infer the moral or reconstruct the hidden meaning of the stories. Symbols, metaphors, analogies, and indirect representations of abstract notions are the motifs’ building blocks. As a result, abstract keywords, like honesty, patience, and courage, rarely appear in the catalog. This approach has the clear benefit of minimizing the subjective interpretation of folklore content.
III. Empirical Analysis: Validation
In this section, we assess whether the motifs in a society’s oral tradition describe (i) natural features in the group’s landscape and (ii) societal aspects known from its ethnographic record.
III.A. ConceptNet
We classify motifs into different concepts using ConceptNet, a knowledge representation project, designed to reflect the general human knowledge and its expression in natural language. It originated from the MIT Media Lab and we use the Web API version: api.conceptnet.io.11 To construct a ConceptNet-based list of related terms, we retrieve the top-50 list for each seed word.
To find the intensity of a given keyword in an oral tradition, we break down each motif into individual words. Berezkin lists the title and the description of a motif in Russian and English. To maximize the information extracted, we translate the Russian version of the motifs using Google’s API translation services, and use both English translations. Then we look up all the related words for every concept and tag the motif accordingly. Hence, we assign each motif to multiple concepts. To arrive at our society-specific estimate of a particular keyword, we add up all motifs tagged by at least one word related to this concept and divide that by the total number of motifs within a group’s oral tradition.
III.B. Folklore and the Natural Environment
Folklorists generally believe that elements appearing in a group’s oral tradition reflect aspects of its migration history and its interactions with other traditions. This implies that images can be preserved even if the landscapes, climates, and social configurations change. Moreover, stories travel because of the interactions among members of different traditions. Eventually, the borrowed stories are integrated into the stock of indigenous folklore (Boas 1916). These migration and cross-pollination processes suggest that the link between a society’s landscape at the time of initial observation (in the late nineteenth and early twentieth centuries) and the geographic attributes mentioned in its oral tradition is not straightforward. Hence, tracing a group’s contemporary ecology in its narratives will increase our confidence in using the motifs to learn about other unknown aspects of these societies.
We examine the following traits we can reliably measure in the group’s folklore and physical environment: (i) proximity to earthquake zones, (ii) intensity of lightning strikes, (iii) annual temperature, (iv) caloric potential from agriculture, and (v) proximity to rivers. In Online Appendix Table II, Panel A, we report the corresponding summary statistics across the 958 societies in Berezkin’s catalog.12 Below we ask whether these natural phenomena are salient enough to manifest themselves in a society’s folklore.
We estimate the following OLS specifications:13
 |
(1) |
The dependent variable is the share of motifs in a group’s oral tradition, i, mentioning a given keyword (along with related words); ac is a vector of continental or country-specific constants; and Geoi is a vector of geographic traits. We use the group’s centroid (recorded by Berezkin) to compute the distance terms and a radius of 200 kilometers to construct the values of the respective geographic attributes. The baseline controls are (i) the log number of publications Berezkin has consulted for a group and (ii) the log year of the earliest publication cited for group i. We cluster the standard errors at the language family level as recorded by Berezkin. There are a total of 75 language families. These include the Indo-European, Algic, Sino-Tibetan, Altaic, Uto-Aztecan, Uralic, Nilo-Saharan, and Niger-Congo families.
1. Images and Episodes in Folklore Reflecting the Physical Environments. In Table I, we present the results. In the first two columns, the dependent variable is the share of motifs tagged by ConceptNet with words related to earthquakes. There are six motifs that typically explain why earthquakes occur. Motif i119, for example, titled: “The dead shake the earth,” has the following description: “The earthquakes are produced by the dead who are in the underworld or during the earthquakes the inhabitants of the lower world try to come out.” Another motif, i28a, is titled “Animals produce earthquakes,” and the description reads: “Big game animals disappear under the earth and produce earthquakes.” We construct the distance from the centroid of each group to the nearest high-intensity earthquake region and follow Bentzen (2019) to define the latter as those in zones 3 and 4. An average group in Berezkin’s data set has  of earthquake-related episodes. However, those located within 100 kilometers of an earthquake zone have
  of such motifs. This pattern is robust to accounting for continental and country fixed effects.
TABLE I.
Folklore and the Physical Environment
| Share of motifs on | ||||||||||
|---|---|---|---|---|---|---|---|---|---|---|
| Earthquake | Storm | Frozen | Crops | River | ||||||
| (1) | (2) | (3) | (4) | (5) | (6) | (7) | (8) | (9) | (10) | |
| ln(Distance to earthquake | −0.1559*** | −0.1659*** | ||||||||
| zones in 1,000 km) | (0.0338) | (0.0508) | ||||||||
| ln(Mean lightning flash | 0.0206 | 0.0412* | ||||||||
| density) | (0.0195) | (0.0224) | ||||||||
| Mean yearly temperature | −0.0194*** | −0.0152** | ||||||||
| 1900–2000 | (0.0026) | (0.0060) | ||||||||
| ln(Optimal agricultural | 0.0594*** | 0.0550*** | ||||||||
| calories pre-1500) | (0.0140) | (0.0144) | ||||||||
| ln(Distance to rivers in km) | −0.0481* | −0.0536* | ||||||||
| (0.0244) | (0.0313) | |||||||||
| Baseline controls | yes | yes | yes | yes | yes | yes | yes | yes | yes | yes |
| Continental FE | yes | no | yes | no | yes | no | yes | no | yes | no |
| Country FE | no | yes | no | yes | no | yes | no | yes | no | yes |
| Adjusted R2 | 0.038 | 0.057 | 0.185 | 0.203 | 0.186 | 0.189 | 0.183 | 0.243 | 0.116 | 0.129 |
| # of observations | 943 | 943 | 942 | 942 | 913 | 913 | 942 | 942 | 943 | 943 |
Notes. This table reports OLS estimates. The unit of analysis is a group in Berezkin’s catalog. Baseline controls include: ln(# of publications) and ln(Year of first publication). As a dependent variable we use the ln(0.01 + Share of concept-specific motifs). Standard errors are clustered at the language family level as recorded by Berezkin. ***, **, * denote significance at 1%, 5%, and 10% levels, respectively. See the main text for variable definition and Online Appendix Table II, Panel A for the summary statistics.
In columns (3) and (4), we use the share of motifs related to “storms” as a dependent variable. A total of 10 motifs mention the words storm or thunderstorm. Motif, i2, present in 56 societies, reads: “Lightning emerges from eyes or mouth of the being who is thought to produce thunderstorms.” Societies located in regions experiencing intense thunder strikes are weakly more likely to feature storm-related episodes in their oral traditions.14 The link becomes statistically significant at conventional levels when we compare groups in the same country.
In columns (5) and (6), we ask whether societies in colder climates feature folklore images typical of their environment. To answer this question, we input the word frozen in ConceptNet. Thirty-nine motifs are tagged by the following terms: cold, ice, frosty, and freeze. Motif c27, titled “A horn in the ice,” is present in 14 oral traditions, and its description reads: “A horned monster breaks ice on river or lake. Usually, people walk across a frozen body of water, get to see a horn protruding from the ice, and try to cut it off. The monster breaks the ice, many people drown.” To explore how climate shapes the frequency of frozen-related motifs, we construct for each society the mean annual temperature between 1900 and 2000. In regions with a mean annual temperature below 10°C, groups’ oral traditions have, on average,  of frozen-tagged motifs, twice as large compared to groups located in warmer places.
The environment exerts a significant influence on a group’s mode of production. For example, groups residing on more fertile lands are, on average, more likely to depend on agriculture. In columns (7) and (8), we ask whether this relationship is also evident in the oral tradition. We use the caloric potential of agriculture in a given region for crops available before 1500 CE from Galor and Ozak (2015).15 To get a proxy for the importance of agricultural activities in a society’s folklore, we combine three keywords that reflect the most commonly cultivated crops worldwide: namely rice, wheat, and corn. We tag 35 motifs. The tagged words are cereal, grain, cob, corn, maize, crop, wheat, flour, and rice. Motif h34g, for instance, can be found in 35 oral traditions and is titled: “One-grain porridge.” Its description reads: “One cereal grain (cob, etc.) is enough to prepare a meal.” Among the 510 groups with zero crop-related motifs, the median regional caloric potential for agriculture is 5,323. This number jumps to 7,235 for groups with at least one farming-related motif. The pattern is the same when we exploit within-continent variation and within-country variation. Because rice, wheat, and corn share many related words, the results are similar if we use them separately. See Online Appendix Table III, Panel A. In the last two columns of Table I, we estimate the relationship between the distance to a river and the incidence of river-related concepts. These include words like river, brook, watercourse, stream, creek, and dam. The median group is 56 kilometers from a river.16 Those further away are less likely to have motifs describing riverine environments.
Online Appendix Figures IVa–e depict the binned scatterplots of the within-country associations. In Online Appendix 3 we discuss additional robustness checks.
III.C. Folklore and the Ethnographic Record
We matched an oral tradition in Berezkin’s database to 1,245 out of the 1,265 groups in the EA. From the 958 groups with oral traditions, 619 mapped into a society present in the EA. Hence, for 339 groups, we have information on their folklore but no ethnographic records. After establishing the empirical relationship between folklore images and ethnographic traits, one can use the former to reconstruct the ethnographic background missing for these ethnicities. We run OLS specifications of the following type:
 |
(2) |
where the EA Traiti is the attribute of interest from the EA for group i located in continent/country c. See Online Appendix Table II, Panel B, for the summary statistics in this sample.
1. Mode of Subsistence
For each type of subsistence, we construct the relevant concept as follows. For hunting activities, we use the words related to hunt. The related terms, found in 144 motifs, are hunt, chase, deer, scavenger, hunter, pursuit, search, and quest. The following hunt-related motif, h19, titled: “Raven tries to starve people,” is found in 27 societies, and its description reads: “Raven hides or scares game animals preventing hunters to kill them. People outwit him.” To capture fishing activities, we use fish, as our seed word. This results in 102 motifs. See Online Appendix Figures Va and b for the distribution of fish- and hunt-related motif frequencies across oral traditions. We use pastoralism as our seed in ConceptNet for animal husbandry. This results in 25 motifs including words like cattle, agriculture, graze, herder, farm, herdsman, livestock, and pasture. Here is the description of a pastoral motif, k136: “A lad becomes a master and a leader of a great amount of cattle (cows or buffaloes) and meets a princess.” Finally, for farming, we use the words related to the crops explained above.
In the odd-numbered columns of Table II, we include continental fixed effects, and compare groups in the same country in the even-numbered columns. In Panel A, columns (1)–(4), the dependent variable is the intensity of crop-related motifs. In the first two columns, the main predictor is the share of subsistence from agriculture (with the omitted category being subsistence needs from all other sources). In the next two columns, instead, we add each of the other three subsistence shares with the omitted category now being that of farming. The measures range from 0 to 9, roughly mapping into the deciles of subsistence needs covered by the corresponding activity. Farming groups “talk” more about crops in their folklore than other societies. Columns (3) and (4) show that this difference is more pronounced when comparing fishing and foraging to farming.
TABLE II.
Folklore, Subsistence, and the Ethnographic Record
| Panel A: Share of motifs on: | ||||||||
|---|---|---|---|---|---|---|---|---|
| Crops | Pastoralism | |||||||
| (1) | (2) | (3) | (4) | (5) | (6) | (7) | (8) | |
| Share of subsistence from: | ||||||||
| Agriculture | 0.0615*** | 0.0490*** | −0.0765*** | −0.0686*** | ||||
| (0.0159) | (0.0124) | (0.0178) | (0.0211) | |||||
| Animal husbandry | 0.0275 | 0.0017 | 0.0722*** | 0.0685*** | ||||
| (0.0200) | (0.0154) | (0.0143) | (0.0176) | |||||
| Fishing | −0.0926*** | −0.0593*** | −0.0677*** | −0.0655*** | ||||
| (0.0215) | (0.0168) | (0.0121) | (0.0146) | |||||
| Hunting and gathering | −0.0705*** | −0.0546*** | −0.0753*** | −0.0749*** | ||||
| (0.0173) | (0.0153) | (0.0154) | (0.0212) | |||||
| R 2 | 0.167 | 0.339 | 0.175 | 0.318 | 0.282 | 0.449 | 0.284 | 0.45 |
| Share of subsistence from: | ||||||||
| Agriculture | −0.0678*** | −0.0691*** | −0.0857*** | −0.0507*** | ||||
| (0.0166) | (0.0194) | (0.0147) | (0.0168) | |||||
| Animal husbandry | −0.0876*** | −0.0837*** | −0.0398* | −0.0124 | ||||
| (0.0197) | (0.0293) | (0.0207) | (0.0199) | |||||
| Fishing | 0.0773*** | 0.0759*** | −0.0540** | −0.0411* | ||||
| (0.0176) | (0.0211) | (0.0231) | (0.0227) | |||||
| Hunting and gathering | −0.0918*** | −0.0869*** | 0.0749*** | 0.0432*** | ||||
| (0.0236) | (0.0283) | (0.0137) | (0.0156) | |||||
| Baseline controls | yes | yes | yes | yes | yes | yes | yes | yes |
| Continental FE | yes | no | yes | no | yes | no | yes | no |
| Country FE | no | yes | no | yes | no | yes | no | yes |
| Adjusted R2 | 0.264 | 0.34 | 0.267 | 0.34 | 0.119 | 0.235 | 0.125 | 0.236 |
| # of observations | 1,233 | 1,233 | 1,233 | 1,233 | 1,233 | 1,233 | 1,233 | 1,233 |
Notes. This table reports OLS estimates. The unit of analysis is a group in the Ethnographic Atlas matched to an oral tradition in Berezkin’s catalog. Baseline controls include: ln(# of publications) and ln(Year of first publication). As a dependent variable we use the ln(0.01 + share of concept-specific motifs). Standard errors are clustered at the language family level as classified in the EA, v98. ***, **, * denote significance at 1%, 5%, and 10% levels, respectively. See the main text for variable definition and Online Appendix Table II, Panel B for summary statistics.
In Panel A, columns (5)–(8), the outcome variable is the share of motifs related to pastoralism, whereas in Panel B, columns (1)–(4) and (5)–(8), the dependent variable is the share of motifs related to fish and hunt, respectively. The beta coefficient on the share of subsistence from herding is 0.27 (column (6)), suggesting a strong influence of the latter on folklore images related to pastoralism. Predominantly fishing-based societies have a median of  fishing motifs in their oral tradition, whereas the corresponding statistic for nonfishing groups is
  . Finally, hunt-specific motifs are robust features of hunting and gathering societies. The former systematically decline as the shares of subsistence from fishing and farming increase.
A complementary way to gauge the predictive power of the mode of subsistence on related images in the group’s folklore is to look at the R2 in specifications without continental or country constants (not reported). The magnitudes range from 0.23 for images on pastoralism to 0.09 for the share of motifs on hunting. In Online Appendix Figures VIa–d, we present binned scatterplots visualizing the relationships established in Table II, Panels A and B, columns (1) and (5).
2. Family Structure
We explore whether groups organized along extended family lines are more likely to feature family members in their oral traditions. Unlike nuclear families, socialization is more likely to occur within the family’s network in extended-family societies. If this is the case, one would expect to see family members often being the protagonists in the stories and tales passed from one generation to the next. We use the words related to mother, according to ConceptNet (using other family members as seeds, we obtain similar patterns). These are mother, father, grandmother, daughter, stepmother, and stepfather. We use variable v8 from the EA that codes the prevailing form of domestic organization and we assign the value 1 to those groups organized as independent nuclear families (with monogamy or occasional polygyny) and 0 otherwise. For 1,218 groups in the EA with such information, 356 are classified as independent nuclear families, while the remaining 862 are polygynous and extended families. In the latter, mother-related motifs show up in  of the total images and episodes recorded in the oral tradition. The corresponding statistic is
  for societies with a nuclear structure. This difference is statistically significant at the
  level. In Online Appendix Table IV, we show that this pattern is robust to exploiting within-continent or within-country variation, respectively. Online Appendix Figure VIIa displays the binned scatterplot of the relationship estimated in column (1).
3. Political Centralization
In Online Appendix Table IV, columns (3) and (4), we ask whether the strength of political complexity in the EA predicts folklore-based measures of political hierarchy. Using the keyword king in ConceptNet, the following words are tagged: king, kingdom, kingship, queen, prince, and princess. Online Appendix Figure Vc illustrates the global distribution of the intensity of king-related motifs across oral traditions. The median society in the EA has no motifs related to a king. This number jumps to  for centralized societies. Hierarchical groups during the precolonial era are systematically more likely to have king-related motifs. Online Appendix Figure VIIb shows the binned scatterplot corresponding to column (3).
IV. Filling in the Gaps in the Ethnographic Record
The fact that folklore-based measures of the economy and the polity are in line with the Ethnographic Atlas suggests that we can complement the ethnographic record by (i) filling in the gaps for groups with missing information and (ii) reconstructing traits that have not been recorded. The two applications below show how to improve the coverage of two extensively used EA variables.
IV.A. Political Centralization
Out of the 1,264 societies in the EA, there is missing information on the layers of jurisdictional hierarchy beyond the local community, variable v33, for 135 groups. We use their folklore to fill in these gaps. After regressing political complexity on the intensity of king-related motifs, we use the estimated coefficient of 0.66 to predict the jurisdictional hierarchy levels across all groups in the EA. In Online Appendix Figure VIIc, we put together two density plots of predicted centralization—one for those groups with EA-recorded levels of hierarchy and the other for those with missing information. On average, societies without ethnographic records on political centralization are predicted to be slightly more complex, although this difference is not statistically significant.
Naturally, one may wonder about the quality of the prediction. One way to go about it is to first look at commonly used variables in the EA that correlate with the variable of interest. Then, for the sample with missing values explore whether the imputed measure displays a correlation structure similar to that present in the nonmissing sample.
Table III, Panel A has the following structure. We use eight variables from the EA and report two bivariate correlations between each of these variables and (i) the EA-recorded measure of centralization and (ii) the folklore-imputed measure in the sample of missing observations. Columns (1)–(4) reflect subsistence shares from hunting and gathering, fishing, herding, and farming, respectively. Column (5) is an indicator equal to 1 if the group engages in intensive agriculture. The variables in columns (6)–(8) are measures of social complexity, including the degree of class stratification, the role of high gods, and the layers of jurisdictional hierarchy above the local level. Overall, the folklore-imputed measure of centralization behaves in a qualitatively similar manner to that recorded by ethnographers. The only variable for which these two measures diverge is the dependence on farming. In the nonimputed sample, there is a significant correlation between reliance on agriculture and political complexity. In the imputed sample, there is no correlation between the two. Nevertheless, when we look at whether a group follows intensive agricultural practices, the correlation is the same in both samples.17
TABLE III.
Comparing Correlations between the Sample where Ethnographic Values Are Observed to those in the Imputed Sample
| Pairwise correlation between | % Hunting and gathering | % Fishing | % Animal husbandry | % Agriculture | Intensive agriculture | Class stratification | High gods | State centralization |
|---|---|---|---|---|---|---|---|---|
| (1) | (2) | (3) | (4) | (5) | (6) | (7) | (8) | |
| Panel A: State centralization | ||||||||
| Nonmissing sample | −0.4538 | −0.2635 | 0.3987 | 0.3663 | 0.4245 | 0.4677 | 0.4003 | 1 |
| # of observations | 1,129 | 1,129 | 1,129 | 1,129 | 1,129 | 1,032 | 724 | 1,129 |
| Sample of missing values | −0.2509 | −0.2132 | 0.4545 | −0.0209 | 0.4017 | 0.2605 | 0.2425 | – |
| # of observations | 128 | 128 | 128 | 128 | 31 | 48 | 22 | – |
| Panel B: High gods | ||||||||
| Nonmissing sample | −0.3568 | −0.3302 | 0.5442 | 0.1735 | 0.3601 | 0.2631 | 0.4003 | |
| # of observations | 748 | 748 | 748 | 748 | 748 | 697 | 724 | |
| Sample of missing values | −0.3899 | −0.2777 | 0.3939 | 0.354 | 0.1309 | 0.1356 | – | 0.2806 |
| # of observations | 500 | 500 | 500 | 500 | 403 | 376 | – | 22 |
Notes. Bivariate corrrelations between state centralization in Panel A and high gods in Panel B with eight ethnographic variables. In the nonmissing EA sample, state centralization (high gods) is the one recorded in the EA. In the sample of missing EA values state centralization (high gods) is the folklore-predicted one.
IV.B. High Gods
The presence of moralizing gods has attracted the attention of scholars in economics, psychology, and beyond. There is a lively debate, for example, on whether complex societies gave birth to big gods or the other way around (Whitehouse et al. 2019). However, the corresponding variable in the EA, v34, is missing for more than  of the groups, limiting the empirical investigations.
According to anthropologists, the crucial attribute of big god societies is the presence of supernatural entities that award and punish humans for their behavior (Schaller et al. 2010). Establishing that such images are present in their folklore would first add large-scale empirical support to this foundational hypothesis. Second, we could use the intensity of such folklore episodes to obtain a measure of moralizing gods where this information is missing.
A single concept cannot capture complex plots of supernatural forces punishing and rewarding. In Table IV, we show how to uncover the intensity of these complex images by combining individual concepts. We focus on three keywords that reflect the themes we are after. In columns (1), (2), and (3), the dependent variable is the share of motifs tagged by “punishment,” “award,” and “supernatural,” concepts, respectively.18 High gods societies are significantly more likely to display punishment in their oral tradition, and episodes featuring rewards and supernatural entities are also more common. We conduct a principal-component analysis to derive an index that jointly captures these three concepts. The first component explains approximately  of the total variance. The second explains around
  , with the third explaining the balance. Importantly, all three concepts load positively on the first principal component. Its eigenvalue is greater than 1, while the eigenvalues of the other two are less than 1 (with 1 being the rule of thumb). We thus focus on the first principal component to construct an index that reflects the joint intensity of punishment, award, and supernatural entities in a group’s oral tradition. We call this “punishing and awarding supernaturals.” Columns (4) and (5) reveal that within continents and countries, groups with big gods, according to ethnographers, are systematically more likely to have an oral tradition that prominently features images of supernatural entities, punishments, and awards. Online Appendix Figure VIIIa shows the binned scatterplot.
TABLE IV.
Folklore and High Gods
| Share of motifs in a group’s oral tradition related to: | |||||
|---|---|---|---|---|---|
| Punishment | Award | Super-natural | 1st PC of ln(share of motifs related to punishment, award, and supernatural) | ||
| (1) | (2) | (3) | (4) | (5) | |
| High gods | 0.1022*** | 0.0697* | 0.0924* | 0.1853*** | 0.1737*** |
| (0.0318) | (0.0371) | (0.0508) | (0.0490) | (0.0548) | |
| Baseline controls | yes | yes | yes | yes | yes |
| Continental FE | yes | yes | yes | yes | no |
| Country FE | no | no | no | no | yes |
| Adjusted R2 | 0.254 | 0.309 | 0.175 | 0.334 | 0.489 |
| # of observations | 733 | 733 | 733 | 733 | 733 |
Notes. This table reports OLS estimates. In all columns the unit of analysis is a group in the Ethnographic Atlas, which has been matched to an oral tradition in Berezkin’s catalog. Baseline controls include: ln(# of publications) and ln(year of first publication). As a dependent variable we use the ln(0.01 + share of concept-specific motifs). Standard errors are clustered at the language family level as classified in the EA, v98. ***, **, * denote significance at 1%, 5%, and 10% levels, respectively. See the main text for the variable definition and Online Appendix Table II, Panel B for the summary statistics.
In the last part, we fill in the values for groups without a record on v34. Specifically, we regress high gods on the folklore intensity of “punishing and awarding supernaturals” and obtain a coefficient of 0.327. In Online Appendix Figure VIIIb, we put together the density plots of the folklore-imputed moralizing gods for the two different samples. One reflects the distribution in the groups where such information is present, and the other corresponds to the groups with missing data. The two distributions largely overlap. In Table III, Panel B we assess the quality of the prediction by comparing the correlations between the predicted measure and other variables from the EA in the imputed sample to the correlations between the EA-recorded high gods and the same variables in the nonimputed sample. Overall, the two sets of correlations are in broad agreement.
These two applications provide a guidance to using a group’s folklore to complete the gaps across the many entries of the EA and the Standard Cross Cultural Sample (SCCS).
IV.C. Using Folklore to Encode Nonextant, Group-Level Characteristics
1. The Case of Trade. Markets are at the heart of any economic analysis. However, the importance of the market economy is entirely missing from the EA. Here we use a society’s folklore to measure this phenomenon. Using trade as the seed the following words are tagged: exchange, trade, swap, barter, trader, and merchant. Motif m171a is present in 79 oral traditions in different parts of the Old World. Its title is “The profitable exchange: gets a bride” and describes a person or an animal that gets to exchange less valuable goods for more valuable ones and ultimately secures a bride. The average group in Berezkin’s database has  of trade motifs (Figure III, Panel A portrays its global distribution). We do two things to explore how informative this measure is. First, we look at the intensity of trade-related motifs as a function of a group’s proximity to preindustrial trade routes. We used data from Michalopoulos, Naghavi, and Prarolo (2018) that compiled a comprehensive set of routes for the Old World from pre-600 CE to 1700 CE. Using these two sets of routes, we constructed the average distance from each group in Berezkin’s database. The summary statistics are telling of a robust, broad pattern. Among the 477 societies in Berezkin’s catalog located in the Old World (Africa, Asia, Europe), those within 200 kilometers of ancient trade routes have an average of
  of trade-related motifs, twice as large compared to those located farther away. Online Appendix Table V, columns (1) and (2) show that this pattern is not driven by cross-continental or cross-country differences.
Figure III.

Trade in Folklore
Panels B and C, conditional on continental FE and baseline controls: ln(# of publications), ln(year of first publication).
Second, in columns (3) and (4) of Online Appendix Table V, we test whether groups spanning different ecosystems are more likely to have an oral tradition rich in trade motifs. This is motivated by Bates’s (1983) view that historical trade was more intense along ecological divides where products from different zones would be exchanged. We follow Fenske (2014) and construct the degree of ecological polarization within a 200-kilometer radius of each group using the dominant ecosystem classes as recorded in the FAO-GAEZ project (we obtain the same pattern if we use ecological diversity). Societies located along more ecologically polarized zones have a larger share of episodes in their folklore describing an exchange taking place. Figures III, Panels B and C show the binned residual scatterplot from columns (1) and (3). Columns (5) and (6) show that both the distance to preindustrial trade routes and ecological polarization are significant predictors of trade images in groups’ oral traditions across and within countries.
V. Folklore and Contemporary Beliefs and Attitudes
Constructing a Country-Level Catalogue of Motifs. To arrive at a catalog of folklore across countries, we first match the oral traditions listed in Berezkin to the ethnic groups in the 1964 Atlas Narodov Mira (ANM). Second, we use a group’s fraction in the country’s population in 2000 (combining the ANM polygons with information on cell-level population density from the Gridded Population of the World in country borders as of 2000) as a weight in our aggregation of motifs at the country level. This procedure is accurate for countries where the indigenous population as of 1500 constitutes a significant fraction of the 1960 population (when the ANM data set was built). However, for the countries for which the ANM lists groups that appeared after 1500 AD, like the Brazilians, Australians, and U.S. Americans, we use the population percentages from the countries of origin as reflected in the Putterman and Weil (2010) global migration matrix.
V.A. From Machine Learning to Learning from Humans
In Online Appendix 4, we show that shrinkage methods can offer a glimpse into the keywords predictive of attitudes across countries today as measured in the GPS data set. Among the thousands of features, the handful selected are sometimes intuitively linked to the outcome of interest. However, the fact that across specifications, the set of selected features varies is reminiscent of Mullainathan and Spiess's (2017) observation about the inherent instability of the models chosen by machine learning methods, particularly in the presence of correlated predictors.
Below we show how one can improve on shrinkage methods based on the assessments of multiple individuals. We focus on trust, risk-taking, and gender norms. Of course, this list is by no means exhaustive. We hope that the methodology can offer some guidance in using folklore to reconstruct a proxy for any cultural value.
1. Trust
We start our analysis looking at trust. Besides its obvious economic significance, we focus on this trait because as discussed in Online Appendix 4 the keywords selected by Lasso change depending on whether trust is measured by the GPS or the World Value Surveys (WVS) data set. Below, we show that how tricksters are treated in a group’s folklore consistently predicts trust levels today irrespective of how the latter is measured.
Tricksters in Folklore. Oral traditions worldwide abound in folktales where tricksters engage in antisocial behavior, including cheating, stealing, and generally deceiving others. A distinguishing feature of these stories is that sometimes the deceiving character seems to get away with their behavior, whereas in other tales, they are punished due to their actions or are simply unsuccessful. To categorize these complex narratives, we hired workers from Amazon Mechanical Turk (MTurk).
First, we identified motifs that mention words related to cheat, deceive, and trick, according to ConceptNet. There are a total of 281 motifs that contain at least one word related to these concepts.19 On average, 15 MTurks read and classified each motif into four mutually exclusive categories: whether the character portrayed in the motif engages in antisocial (absurd, obscene, or deceiving) behavior, and whether they are successful. In Online Appendix Figure IX, we provide an example of a motif that MTurks classified along with the instructions provided. For more details on the MTurk platform and the classifications, see Online Appendix 5.
Here are two examples of motifs describing antisocial behavior. Motif k122, found in 26 societies, mainly in Europe and the Middle East, reads “Hero gets to the powerful woman who lives in another world, then returns to the world of humans. Imposter claims the hero’s deeds for himself. The powerful woman comes and finds the real hero, punishes (rejects) the deceiver.” All MTurks classified this as an instance of antisocial behavior where the character is unsuccessful/punished. On the contrary, the motif depicted in Online Appendix Figure IX, mainly found in the Americas, is classified as “antisocial and successful” by  of the MTurks with
  choosing the last option, that is, “antisocial but outcome is not described.” For each motif, we use the most common classification.20
Out of the 281 motifs, 57 are uniquely classified as “not antisocial” and hence are not considered. In  of the remaining 224, the trickster is depicted as successful,
  as unsuccessful/punished, and for another 46 motifs, MTurks thought that the outcome of the antisocial behavior could not be determined. We aggregate the intensity of motifs at the group and at the country level. The key variable of interest is how often tricksters fail compared with instances where the character engaging in antisocial behavior is either successful or not explicitly punished.
Below, we explore whether a group’s level of generalized trust is influenced by how cheating is portrayed in its oral tradition. Perhaps it is instructive to pause here and ask whether a society with a relative abundance of motifs where tricksters get punished reflects a high- or low-trust group. To the extent that narratives in a group’s folklore encapsulate the equilibrium a community has converged to, one would expect oral traditions that typically highlight the punishment of tricksters to reflect an environment of low tolerance toward antisocial behavior.
Across Countries. To arrive at the folklore measure of trust, we subtracted the country-level frequency of motifs where antisocial behavior is punished from the instances where the antisocial behavior was not (explicitly) punished. We normalize these frequencies by the total number of motifs in the country. The cross-country mean equals  , that is, on average, tricksters are more likely to get away with their actions. On the one end, there are countries like Bahrain (with the maximum score of
  ), Sri Lanka, Denmark, and the Netherlands where antisocial behavior is disproportionately punished compared with countries like Togo (with the minimum score of
  ), Angola, Haiti, Burkina Faso, Bosnia and Herzegovina, and Myanmar, where tricksters go unpunished much more often than not. Figure IV, Panel A illustrates the intensity of the trickster’s relative punishment in folktales across countries, and Panel B shows the histogram.
Figure IV.

Punishment of Tricksters in Folklore
Panels B–D, MTurk classification of motifs tagged by the concepts cheat, deceive, and trick into trickster punished or not; Panels C and D, conditional on log year of earliest publication and log # of publications
Table V consists of three panels that show how the rate at which antisocial behavior is punished maps into current levels of trust and economic activity. In Panel A, the unit of analysis is a country. In the first two columns, the dependent variable is the average response to the commonly used generalized trust question in the WVS/EVS. Column (1) reveals a striking positive link between trust today and narratives of low tolerance of antisocial behavior across countries. The variation in the latter explains roughly  of the overall variation in self-reported trust levels. This correlation is also quantitatively meaningful. A 1 standard deviation increase in the rate at which tricksters are unsuccessful is associated with an increase in trust of roughly 0.35 standard deviations. See Figure IV, Panel C for the binned residual scatterplot. Column (2) shows that this association also holds within continents. The pattern is quantitatively similar in columns (3) and (4), where we use the GPS measure of trust. In the last two columns, we replace trust with log GDP per capita in 2010. Across 161 states, those with an oral tradition that strongly disapproves of antisocial behavior are more prosperous today, see Figure IV, Panel D for the residual scatterplot.
TABLE V.
Punishment of Tricksters in the Oral Traditions, Trust, and Economic Performance
| Panel A: Across countries | ||||||
|---|---|---|---|---|---|---|
| Dependent variable | Trust (WVS/EVS) | Trust (GPS) | ln(GDP pc in 2010) | |||
| (1) | (2) | (3) | (4) | (5) | (6) | |
| Relative punishment of antisocial behavior | 1.8560*** | 1.5383*** | 5.3760*** | 3.9233* | 20.8954*** | 11.0059*** |
| (0.4794) | (0.5372) | (1.1388) | (2.1495) | (3.4327) | (3.6698) | |
| Baseline controls | yes | yes | yes | yes | yes | yes |
| Continental FE | no | yes | no | yes | no | yes |
| Adjusted R2 | 0.205 | 0.317 | 0.188 | 0.194 | 0.382 | 0.55 |
| # of observations | 104 | 104 | 76 | 76 | 160 | 160 |
| Panel B: Across second-generation immigrants in Europe | ||||||
| Dependent variable | How much people can be trusted | Income decile | ||||
| (1) | (2) | (3) | (4) | |||
| Relative punishment of antisocial behavior | 1.0988*** | 1.0659*** | 3.1897 | 5.7285** | ||
| (0.3689) | (0.4018) | (3.5655) | (2.8876) | |||
| Baseline controls | yes | yes | yes | yes | ||
| Individual controls | no | yes | no | yes | ||
| Country - Round FE | yes | yes | yes | yes | ||
| Adjusted R2 | 0.065 | 0.072 | 0.129 | 0.195 | ||
| # of observations | 6,554 | 6,554 | 4,720 | 4,720 | ||
| Relative punishment of antisocial behavior | 3.2826** | 3.1853* | 4.8432*** | 3.9384* | 4.3934** | 4.4554** |
| (1.5809) | (1.6225) | (1.7276) | (2.0552) | (2.1410) | (1.9097) | |
| Baseline controls | yes | yes | yes | yes | yes | yes |
| Continental FE | yes | no | yes | no | yes | no |
| Country FE | no | yes | no | yes | no | yes |
| Adjusted R2 | 0.357 | 0.487 | 0.256 | 0.4 | 0.289 | 0.408 |
| # of observations | 942 | 942 | 578 | 578 | 365 | 365 |
Notes. All panels report OLS estimates. In Panel A the unit of analysis is a country. In Panel B we use individual-level data from the European Social Surveys rounds 1 to 8 and focus on respondents born in the same country of the interview, and both of whose parents are born in the same country abroad. In Panel C, columns (1) and (2) an observation is a group in Berezkin’s catalog; in columns (3)–(6) we look at ethnicities in the Ethnographic Atlas. Baseline controls include: ln(# of publications) and ln(year of first publication). Individual controls include age decile fixed effects, a gender indicator, self-reported health status fixed effects, and religion-specific constants. Standard errors, reported in parentheses, are robust in Panel A. In Panel B, standard errors are clustered at the country of origin of the parents of each individual. In Panel C, columns (1) and (2), standard errors are clustered at the language family (as classified by Berezkin). In columns (3)–(6), standard errors are clustered at the language family level as classified in the EA, v98. ***, **, * denote significance at 1%, 5%, and 10% levels, respectively.
Across Second-Generation Immigrants. Given the cross-country association between contemporary trust attitudes and tricksters’ punishment, the natural question becomes whether the parental folklore of second-generation immigrants may help explain differences in trust levels today. Finding such a pattern would be consistent with the intergenerational transmission of values via traditional narratives.
To answer this question, we turn to the European Social Survey rounds 1 to 8 conducted between 2002 and 2016. We focus on second-generation immigrants whose parents have the same country of origin (Fernandez 2011).
There are a total of 6,554 second-generation adult immigrants in our sample whose parents were born in 117 countries worldwide. In the first two columns of Table V, Panel B, the dependent variable reflects the answer to the question “Most people can be trusted or you can’t be too careful?” In columns (3) and (4), the dependent variable is the decile in the income distribution of the respondent’s income in the specific country-round.
The empirical specification takes the following form:
 |
(3) |
where Outcomei,c,o,r is that of individual i, residing/born in country c, interviewed in round r, whose parents were both born in country o.  is a vector of personal characteristics, including age decile fixed effects, gender, self-reported health status fixed effects, and religion fixed effects.21 We cluster the standard errors at the oral tradition level (country of origin of the parents) and ac,r reflect round-country-of-interview specific constants. The baseline controls are the same as those discussed already. All columns include the baseline controls and country-round fixed effects. In the even-numbered columns, we add on top the set of individual-level controls.
The pattern uncovered among second-generation immigrants in European countries echoes the cross-country picture. Those who trace their ancestry to oral traditions where tricksters are often unsuccessful are systematically more trusting and enjoy in the same country higher incomes than those with a heritage of an oral tradition where antisocial behavior is not prominently punished. The possibility that today’s trust levels can be traced in how tricksters are portrayed in the narratives that children grow up listening to suggests the long-lasting influences of early-life environments.
Across Ethnic Groups. Trust attitudes across ethnic groups at a global scale are not available. This is why the literature on culture has often focused on the immigrants’ country of origin, exploiting within-country variation in cultural traits. Nevertheless, thanks to Berezkin’s catalog we may reconstruct values and beliefs at the ethnic group level. Figure V, Panel A portrays the intensity of trickster punishment across the 958 ethnic groups. There is substantial variation both across and within countries in how tricksters fare.
Figure V.
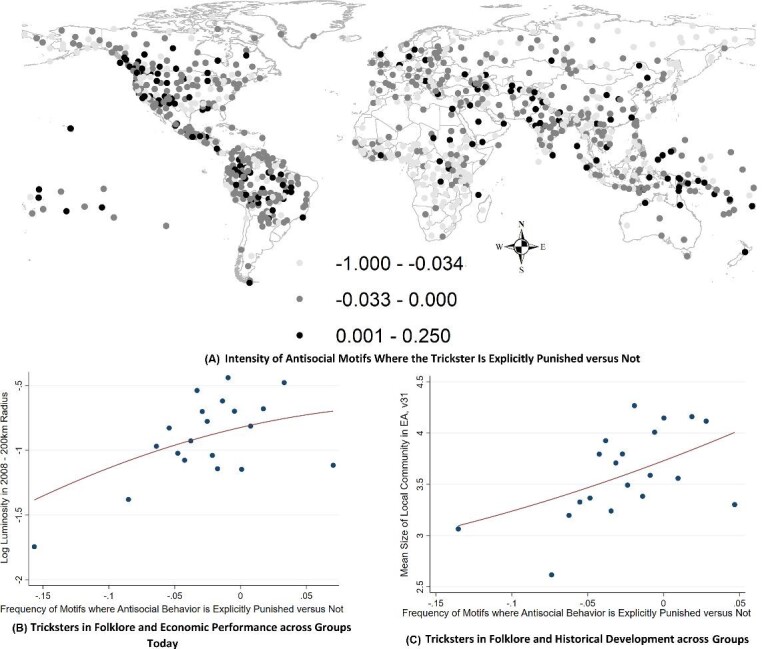
Tricksters in Folklore and Economic Consequences
Panels B and C: conditional on baseline controls and continental FE; MTurk classification into trickster punished or not of motifs tagged by the concepts cheat, deceive, and trick.
For example, consider the three groups that Berezkin lists for Afghanistan. These are the Pashto, one of the main language groups, the Kafirs, Nuristani people, and the Wahki/Ishkashimi/Munji groups, who all speak Pamir languages. There are significant differences in the fate of tricksters across these three groups. Among Kafirs, tricksters are usually punished. Tales where the deceiving character fails, exceed those where he is successful by 2 percentage points. In contrast, in the Wahki/Ishkashimi/Munji folklore, the frequency at which tricksters succeed exceeds that of failing by almost 5 percentage points. The Pashto are somewhere in between, with the punishing motifs falling behind the motifs where tricksters are successful by roughly 1 percentage point.
In Table V, Panel C we show that differences in tricksters’ outcomes can explain part of the variation in economic performance across groups historically and today. In columns (1) and (2), we use the average luminosity in 2008 per square kilometer in a radius of 200 kilometers of each group’s centroid. Both within and across countries, we find that groups whose oral tradition sanctions tricksters’ behavior often are more developed today. Figure V, Panel B displays the binned scatterplot corresponding to column (1). Going back to the example of the groups in Afghanistan, the Wahki/Ishkashimi/Munji are at the bottom of the within-Afghanistan luminosity distribution, with Kafirs being on the top.
In the last four columns of Table V, Panel C, we show that historical development across ethnic groups also correlates strongly with peoples’ values as deduced from folklore. To capture historical development in a Malthusian, preindustrial setting, we use local communities’ mean size from the EA, v31. Groups are classified into eight bins in ascending order ranging from societies with less than 50 people to groups with more than 50,000 members. Historically more populous groups depict tricksters failing in their attempts to deceive. See Figure V, Panel C for the relationship estimated in column (3). This pattern is not driven by comparing farming societies to others. In columns (5) and (6), we focus on groups that derive most of their subsistence from agriculture. Among farmers, those with stronger norms against cheating are more developed historically. The association between economic performance and the folklore-based measure of trust is quantitatively stable over time. The beta coefficients estimated in Table V, Panel C, columns (2) and (4) are both around 0.08.
This example highlights the usefulness of folklore in shedding light on historical beliefs and attitudes across ethnic groups worldwide and their economic consequences in the past and the present.
2. Risk-Taking
In this section we focus on risk attitudes. The latter play a pivotal role in shaping entrepreneurial activity, and the propensity to accept risk varies considerably across societies. Tales of challenges and competitions are recurrent themes across oral traditions and the machine learning estimates presented in Online Appendix Table VI reveal that the keywords related to competitions predict higher risk-taking across countries today. Naturally, one may wonder whether tales where the character(s) wins a contest are more likely to encourage risk-taking than narratives where such dangerous interactions are detrimental to the hero’s well-being.
To get at this distinction, we had each of the 87 motifs mentioning a word related to challenges and competitions, classified by nine MTurks on average.22 The question we asked reads: “The character(s) in this motif finds him in a challenging/difficult situation. Is the character(s) successful in getting out of it?” We use the modal answer allowing for multiple classifications in case of more than one mode. On the one hand,  of the challenge-tagged motifs portray a character(s) who is successful. Take, for example, motif k38f titled “Dragon winner” found in 115 oral traditions. Its description reads: “A reptile monster demands humans (usually virgins) as a sacrifice or abducts a girl or closes sources of water. Hero kills him.” Several motifs describe challenges but without specifying the outcome. For example, motif k27e titled “Eating or drinking contest” describes a person or animal that must consume enormous quantities of poisonous food.
On the other hand, in  of these competition-related themes, the character is harmed. Motif c33, for instance, present in 12 oral traditions is titled “Prometheus (the chained strong man)” and describes a strong man who ventured to confront God and is for eternity chained to a mountain; see Online Appendix Figure Xa. Finally, 7 out of the 87 motifs are considered by the MTurks as not describing a challenging situation. Below, we show that these different classifications have a qualitatively different relationship with attitudes towards risk-taking.
Across Countries. In Online Appendix Table VII, Panels A and B, we present the summary statistics and the correlation structure among the outcomes of contests and competitions across the oral traditions of 199 countries. The average country has roughly  of such themes in its folklore. In one out of every six of these episodes (
 of all motifs), the character fails. The rest of the time, he is unharmed by the challenge.
In the first two columns of Table VI, we exploit across- and within-continent variation. Countries with a larger share of challenge and competition-related motifs in their folklore are more risk-tolerant according to the GPS today. This pattern is expected, given that the Lasso exercise already selected these keywords. In column (3), we go a step further and distinguish between the different outcomes. The intensity of images where the character is successful maps onto an increased appetite for risk. Episodes describing competitions without specifying an outcome are also positive and significant predictors of risk-taking (although in terms of magnitudes, the estimated beta coefficient of 0.17 is roughly 60% smaller than the corresponding coefficient for the intensity of successful challenges). Notably, motifs that portray competitions as detrimental to the character’s well-being, that is, lead to tragedies, are inversely related to risk-taking. Finally, contest-related motifs that the MTurks classified as describing no such interactions are unrelated to risk attitudes. To put the numbers in context, consider the following example. According to the GPS data set within Europe, the most risk-tolerant country is the Netherlands, whereas Russia is third from the bottom and thus one of the most risk-averse. The share of tales depicting a hero overcoming challenges is twice as common in the Dutch folklore than in the Russian one.
TABLE VI.
Challenges and Competitions across Oral Traditions and Risk-Taking and Entrepreneurship Today
| Across countries | Across 2nd-generation immmigrants in Europe | |||||||||
|---|---|---|---|---|---|---|---|---|---|---|
| Dependent variable | Risk-taking (GPS) | ln(# of patents from country’s residents per 100,000 in 2006–2018) | ln(New business registrations per 1,000 people ages 15–64 in 2006–2018) | Self-employed | ||||||
| (1) | (2) | (3) | (4) | (5) | (6) | (7) | (8) | (9) | (10) | |
| Share of motifs on challenges and competitions | ||||||||||
| All | 5.4381*** | 5.6802** | ||||||||
| (1.7645) | (2.3076) | |||||||||
| where the character is | 11.6165** | |||||||||
| successful | (4.5020) | |||||||||
| where the character is | −5.1016 | |||||||||
| unsuccessful | (4.9413) | |||||||||
| where the character | 7.9918* | |||||||||
| is neither successful nor unsuccessful | (4.3289) | |||||||||
| where no challenges are | 6.6558 | |||||||||
| present | (13.4506) | |||||||||
| where the character is | −9.5625*** | −31.0346*** | −23.0564** | −30.2746*** | −16.7612** | −1.8689*** | −1.4029*** | |||
| relatively unsuccessful | (2.7163) | (11.4762) | (10.0005) | (7.1015) | (7.1745) | (0.3955) | (0.3906) | |||
| Baseline controls | yes | yes | yes | yes | yes | yes | yes | yes | yes | yes |
| Individual controls | no | no | no | no | no | no | no | no | no | yes |
| Continental FE | no | yes | yes | yes | no | yes | no | yes | no | no |
| Country-round FE | no | no | no | no | no | no | no | no | yes | yes |
| Adjusted R2 | 0.13 | 0.235 | 0.257 | 0.274 | 0.409 | 0.535 | 0.263 | 0.343 | 0.057 | 0.077 |
| # of observations | 76 | 76 | 76 | 76 | 140 | 140 | 147 | 147 | 6,063 | 6,063 |
Notes. In columns (1)–(8) the unit of analysis is a country. In columns (9) and (10) we use individual-level data from the European Social Surveys rounds 1 to 8 and focus on respondents born in the country of the interview, both of whose parents are born in the same country abroad. To construct the share of challenge-related motifs where the character is relatively unsuccessful we substract from the share of unsuccessful motifs the share of motifs where the character is either successful or not explicitly harmed. Baseline controls include: ln(# of publications) and ln(year of first publication). Individual controls include age decile fixed effects, a gender indicator, self-reported health status fixed effects, and religion-specific constants. Standard errors (reported in parentheses) are robust in columns (1)–(8) and are clustered at the country of origin of the parents of each individual in columns (9) and (10). ***, **, * denote significance at 1%, 5%, and 10% levels, respectively.
Motivated by these patterns and to get at a single measure of the outcome of challenges and competitions, we subtract from the share of motifs where challenges lead to failures the episodes where characters are not (explicitly) harmed. In column (4), we show that the relative frequency of harmful contests significantly lowers attitudes toward risk today. Online Appendix Figure Xb depicts the residual scatterplot.
The remaining columns in Table VI illustrate that these tales also predict entrepreneurial activity today. We capture the latter with two proxies. In columns (5) and (6), we use the number of patents filed by residents per 100,000 people, and in columns (7) and (8), we use the number of new business registrations (limited liability corporations) per 1,000 people aged between 15 and 64.23 Both these measures are in logs and reflect the 2006–2018 averages. Across and within continents, countries whose folklore depicts challenges as opportunities instead of tragedies record higher entrepreneurial rates. In Figures VI, Panels A and B, we depict the variation in risk attitudes as proxied by the relative intensity of harmful contests across countries and ethnic groups, respectively.
Figure VI.

Intensity of Challenge-Related Motifs Where the Character Fails versus Not
Across Second-Generation Immigrants. Comparing entrepreneurial activity across countries is not easy since patenting activity and incorporation rates, for example, are very much influenced by a country’s institutional framework, among other things. Hence, the literature has converged to using self-employment rates across individuals in the same state as a more meaningful proxy of entrepreneurial attitudes. In the last two columns of Table VI, we focus on second-generation immigrants and ask how parental folklore influences the probability of self-employment.24
The empirical specification follows that of equation (3). There are a total of 6,063 second-generation immigrants in our sample with a probability of self-employment of  . Their parents were born in 106 countries. The difference between columns (9) and (10) is that we add individual controls in the latter. In both specifications, we compare individuals born and currently living in the same country and hence facing similar institutional arrangements. Second-generation immigrants whose parental folklore depicts contests and competitions unfavorably are systematically less likely to be self-employed. The estimated coefficient in column (9) suggests that a 1 percentage point increase in such images decreases the probability of self-employment by approximately 2 percentage points (see Online Appendix Figure Xc for the binned scatterplot).
The following example is indicative of the overall pattern. Within Israel, two large groups of second-generation immigrants are those whose parents came from Morocco and Romania. Individuals of Romanian ancestry have a  likelihood to be self-employed, whereas those whose parents hail from Morocco have a
  probability. In Moroccan folklore, the likelihood that fictional characters get out of difficult and challenging situations instead of being hurt is a mere
  . This number is three times as large in the Romanian folklore (
 ).
).
3. Gender Roles in Folklore
In this section, we focus on extracting gender norms from folklore images. The importance of gender attitudes transcends the social sciences and humanities. For example, economists motivated by famous works in anthropology have empirically linked specific agricultural traits to the role of women, ranging from the presence of the plow (Alesina, Giuliano, and Nunn 2013), to tea or cotton cultivation (Qian 2008; Xue 2016), and the extent of the pastoral economy (Becker 2019). This line of thinking links the (geographically determined) relative returns of female labor force participation to women’s status in the past and via a process of intergenerational transmission to their role in the present. Tracing gender stereotypes in the oral tradition of a given society will allow us first to understand women’s relative status in our ancestors’ narratives. Second, it will allow us to assess whether the way women are depicted in a group’s folklore is predictive of their position today.
Although pinpointing which motifs mention a male or female character is straightforward, what exactly one should classify is not. For example, asking whether women (men) engage in good or bad actions would deliver answers that would hardly be comparable as these assessments are value system–dependent. To circumvent this delicate issue, we ask whether the character is portrayed stereotypically drawing insights from research on media. Towbin et al. (2004), for example, look at how women and men are depicted in Disney movies and Lauzen, Dozier, and Horan (2008) study the social roles enacted by female and male characters in prime-time television programs in the United States.
The literature predominantly associates men with being violent/dominant/strong, (physically) active, angry, arrogant, and sexual. The women’s categories include being emotional, beautiful, and domestic/dependent/submissive. We explore many of these stereotypes in our analysis. Online Appendix Figure XI shows an example of a motif that MTurks classified along with the instructions.
MTurks classified a total of 1,073 male and/or female motifs.25 In 586, both a male and a female character are present, whereas in 296 (191) motifs, only a male (female) character is detected. We allow the MTurks to choose more than one classification as the characters may display a variety of qualities in the same motif. To classify a given motif, we choose the most common answer. For 29 (81) motifs out of the 777 (882) tagged as having a female (male) character, the unique mode chosen by MTurks was “no gendered entity present.” We do not consider these motifs in the analysis. Again in case of a tie, we allow for multiple classifications.
We start by exploring the gender stereotypes across motifs in Berezkin’s catalog in Online Appendix Table VIII. Being violent, dominant, and arrogant is the most common representation of male characters with a  frequency. The corresponding statistic for women suggests that for every image of a violent and dominant man, there is half of a motif where a woman displays such qualities. On the contrary, the most common theme among female characters is that of being submissive and dependent, with about
  of female motifs having such representation. This number is two and a half times smaller for men. A similar pattern emerges when we look at the incidence of other stereotypes. Compared with men, women are almost twice as likely to appear engaging in domestic affairs and half as likely to be physically active. However, relatively more images depict women as sexual, and on average, women are more intelligent and less naive than men. MTurks classified the overwhelming majority of male and female motifs (
 ) into the stereotypes provided. For the remaining
  the category “other” was chosen. This suggests that besides the attributes listed, there are other aspects that the current classification does not capture. Future work should shed light on the topics that make up the residual category.
The catalog of oral traditions reveals stark gender disparities.26 Before showing how gender roles aggregate at the country and group level it is vital to keep in mind prominent folklorist Mary Ellen Brown (1989). She highlights how the folkloristic procedures may affect and skew the collection and analysis of expressive culture. These include the selection of informants, the dimensions of traditional culture that become accessible to outsiders, and how the gender, age, class, or race, and the collector’s biases influence the recorded narratives. This is why establishing a link between gender bias in folklore and women’s current status is vital. It would suggest that, notwithstanding these considerations, variation in gender roles across oral traditions reflects cross-cultural differences in historical gender norms.
Across Countries. In Online Appendix Table IXa, we present the summary statistics on gender representation across the folklore of 199 countries. We define as male bias the difference between male and female motifs for a given stereotype and normalize it by the total number of motifs in a country’s oral tradition. For example, the cross-country mean of male bias in submissive motifs is  , that is, in the oral tradition of the average country, women compared with men are roughly
  more often depicted as submissive. Negative numbers indicate a lower prevalence of the specific stereotype among men compared to women. On average, men appear as more dominant, less submissive, more intelligent, more physically active, and less engaged in domestic affairs than women. Overall, there are no gaps in gender representation in terms of sexuality and naiveté.
To assess whether these stereotypes appear in bundles or are distributed evenly across countries, in Online Appendix Table IXb, we look at the correlation structure of the different dimensions of gender bias across countries. Oral traditions portraying men as violent and arrogant feature women in a submissive status and also depict men as more physically active and less engaged in domestic affairs. Male bias in sexuality, intelligence, and naiveté are weakly correlated with male bias in terms of violence. Informed by these patterns, we create two variables. The first captures the degree to which an oral tradition describes males relative to women as more violent, less dependent, less engaged in domestic affairs, and more physically active. We call this male dominance bias. The other variable reflects the degree to which men are portrayed as more intelligent and less naive than women; we call this male mental capacity bias. Figure VII, Panel A illustrates the spatial distribution of male dominance bias across the globe.
Figure VII.

Male Bias
Male bias: rate at which men relative to women are depicted as more dominant, less submissive, less engaged in domestic affairs, and more physically active. Panel B: Conditional on continental FE, log year of earliest publication, and log # of publications.
A few examples may set the stage for the following empirical analysis. The Philippines is a country with negligible bias against women in its folklore ranking 195th out the 199 countries in the sample. Compared with other parts of Southeast Asia, women’s legal and family property rights have not been questioned. On the contrary, in Afghanistan the extent of male dominance bias in the folklore images is almost twice that of the average country. Another striking comparison is between Lesotho and Swaziland (now officially known as the Kingdom of Eswatini). Both are small, ethnically homogeneous, landlocked countries in southern Africa. Despite these similarities, the status of women differs dramatically between them. Swazi women lack fundamental legal rights, including the right to own assets, and are subject to widespread discrimination and violence. According to the Gender Inequality Index created by the UNDP, Swaziland ranked 150th out of 188 countries in the world in 2012. At the level of traditional narratives, Swazi’s folklore has the dubious distinction of being close to the top of the global distribution in terms of displaying men as physically active and disengaged from domestic affairs compared with women. On the contrary, Basotho women are historically known as agents of economic empowerment, wielding significant decision power in the household (Eldredge 1991). As of 2012, women’s literacy rate was  , compared with
  for men. Lesotho’s oral tradition, mainly consisting of narratives from the Sotho group, is in fact the only one in the world where men appear less violent than women. Women’s labor force participation is about
  in Swaziland versus
  in Lesotho. Similar contrasts can be found in other continents.
A commonly employed measure of women’s status today is labor force participation. This proxy is available for a large number of countries, and it is relatively precisely estimated. In Table VII, Panel A we ask whether variation in male bias across oral traditions maps into variation in how much women are embedded in the labor market as of 2019. In columns (1) to (3), we include the baseline controls, and we add the three different measures of male bias sequentially. In column (1), we introduce the male dominance bias. It enters with a negative sign, and it is precisely estimated. In societies that feature relatively more images of dominant and physically active men and dependent and home-bound women, women are systematically less integrated into the labor market. A 1 standard-deviation increase in male dominance bias decreases female labor force participation by 0.39 standard deviations reflecting a high sensitivity of women’s status in the labor force to the oral tradition they are exposed to. Variation in male dominance bias across the globe accounts for roughly  of the heterogeneity in female labor force participation. See Figure VII, Panel B for the residual scatterplot. In columns (2) and (3), we introduce the male mental capacity bias and the male sexual bias. Neither aspect seems to be systematically related to women’s labor force participation. Columns (3) to (6) replicate the first three adding continental fixed effects. Exploiting within-continent variation delivers a similar pattern. One may wonder whether the aggregation of the dimensions of male bias masks some interesting heterogeneity. In Online Appendix Table X, we introduce one dimension of male bias at a time. The results echo those of Table VII, Panel A.27
TABLE VII.
Gender Norms across Oral Traditions and the Role of Women Today and Historically
| Panel A: Across countries | ||||||
|---|---|---|---|---|---|---|
| Female labor force participation in 2019 | ||||||
| (1) | (2) | (3) | (4) | (5) | (6) | |
| Male dominance bias in the oral tradition | −111.9018*** | −108.8809*** | ||||
| (22.2059) | (25.2061) | |||||
| Male mental capacity | 69.8931 | 73.4037 | ||||
| bias in the oral tradition | (46.8905) | (53.2801) | ||||
| Male sexual bias in the oral tradition | 73.8563 | −5.0315 | ||||
| (125.1493) | (145.6141) | |||||
| Baseline controls | yes | yes | yes | yes | yes | yes |
| Continental FE | no | no | no | yes | yes | yes |
| Adjusted R2 | 0.136 | 0.004 | −0.011 | 0.145 | 0.051 | 0.034 |
| # of observations | 174 | 174 | 174 | 174 | 174 | 174 |
| Panel B: Across second-generation immigrants in Europe | ||||||
| Agree with the statement: | ||||||
| Housewife | Men should have more right to job than women when jobs are scarce | Women should be prepared to cut down on paid work for sake of family | ||||
| (1) | (2) | (3) | (4) | (5) | (6) | |
| Male dominance bias in the oral tradition | 0.5739*** | 0.4206** | 1.8022*** | 1.7888** | 3.3846*** | 3.0251*** |
| (0.1799) | (0.1692) | (0.6563) | (0.7274) | (0.9648) | (0.9089) | |
| Baseline controls | yes | yes | yes | yes | yes | yes |
| Country - round FE | yes | yes | yes | yes | yes | yes |
| Individual controls | no | yes | no | yes | no | yes |
| Adjusted R2 | 0.025 | 0.051 | 0.158 | 0.182 | 0.082 | 0.098 |
| # of observations | 3,468 | 3,468 | 3,765 | 3,765 | 2,726 | 2,726 |
| Men contribute more | 0.0408*** | 0.0345*** | 0.0191** | |||
| than women in agriculture; EA | (0.0107) | (0.0111) | (0.0084) | |||
| Plow is indigenous to the society; EA | 0.0565*** | 0.0614*** | 0.0364** | |||
| (0.0132) | (0.0082) | (0.0180) | ||||
| Baseline controls | yes | yes | yes | yes | yes | yes |
| Continental FE | no | yes | no | no | yes | no |
| Country FE | no | no | yes | no | no | yes |
| Adjusted R2 | 0.056 | 0.083 | 0.201 | 0.049 | 0.064 | 0.179 |
| # of observations | 702 | 702 | 702 | 1,131 | 1,131 | 1,131 |
Notes. Both panels report OLS estimates. In Panel A the unit of analysis is a country. In Panel B we use individual-level data from the European Social Surveys rounds 1 to 8 and focus on respondents born in the country of the interview, both of whose parents are born in the same country abroad. Male dominance bias is defined as the share of motifs where men are depicted as more dominant, less submissive, less engaged in domestic affairs, and more physically active than women in a given oral tradition. Male mental capacity bias is the share of motifs where men are depicted as more intelligent and less naive than women. Finally, Male sexual bias is the share of motifs where men are depicted as more sexual than women in the oral tradition. Columns (1) and (2) in Panel B focus only on female respondents. Baseline controls include ln(# of publications) and ln(year of first publication for the oral tradition). Individual controls include age decile fixed effects, a gender indicator, self-reported health status fixed effects, and religion-specific constants. Standard errors (reported in parentheses) are robust in Panel A and are clustered at the country of origin of the parents of each individual in Panel B. ***, **, * denote significance at 1%, 5%, and 10% levels, respectively. In Panel C the unit of analysis is a group in the Ethnographic Atlas. In columns (1)–(3) we focus on groups for which agriculture is not an unimportant activity according to variable v54 and the independent variable takes the value 1 if men contribute more to agriculture than women. Baseline controls include: ln(# of publications) and ln(year of first publication). Standard errors (reported in parentheses) are clustered at the linguistic family level (variable v98 in the EA). ***, **, * denote significance at 1%, 5%, and 10% levels, respectively.
Across Second-Generation Immigrants. Having established a robust inverse association between male dominance themes in a country’s oral tradition and contemporary women’s status around the world, we turn to second-generation immigrants.
The empirical specification follows equation (3). In Table VII, Panel B we include country-round fixed effects and the baseline controls. In the even-numbered specifications, we add individual-level controls. We look at three outcomes. The first reflects an economic choice, whereas the other two capture attitudes toward gender equality. Specifically, in the first two columns, we focus on female adult respondents, and the dependent variable is an indicator that takes the value of 1 if the individual answers that her main activity in the last seven days before the survey is “housework, looking after children, and others.” The variation in oral traditions comes from 102 countries of parental origin. In columns (3) to (6), the dependent variable encodes how much a respondent agrees with the following two statements. In columns (3) and (4), the statement reads: “Men should have more right to a job than women when jobs are scarce,” and in columns (5) and (6), the statement is: “Women should be prepared to cut down on paid work for sake of the family.” The possible answers range from 1 to 5, with 1 indicating that the respondent disagrees strongly and a value of 5 that they strongly agree.
The message is consistent across specifications. In European countries among second-generation immigrants, females whose parents hail from a society with a strong male dominance bias in its oral tradition are more likely to be homemakers. Moreover, male and female respondents from male-biased oral traditions are more comfortable sacrificing women’s labor force participation. Quantitatively speaking, the beta coefficients in columns (1) to (6) are between 0.05 and 0.10. The magnitudes decline slightly but remain significant when we add the individual-level controls.
Ethnic Groups.
Figure VIII, Panel A depicts the male dominance bias across groups in Berezkin’s catalog. There is significant heterogeneity within countries. India’s diversity in languages is also reflected in their oral traditions. For example, among the Khasi people (an indigenous ethnic group in north eastern India), their folklore shows gender parity in the various stereotypes suggesting a society where gender roles are fluid. On the contrary, the Kashmiri group is among the top three groups in India in terms of male bias. Motifs portraying men as dominant exceed images where women appear as such by  . In this society, the oral tradition depicts the different roles that men and women occupy in unambiguous terms. Similar within-country differences across oral traditions appear in other continents. In Brazil, for example, the Caduveo and the Palikur among the indigenous groups have oral traditions where the male dominance bias is negative. This means that women dominate men, at least in images and episodes narrated among these groups. On the contrary, in the Umotina’s folklore, the male dominance bias estimate is 0.45. It is the highest across all groups in Brazil and ranks in the top 10 among oral traditions globally. In Russia, Chechens top the male dominance bias across indigenous folklore with a score of 0.25, with groups like the Kets (a Yeniseian people in Siberia) being at the bottom with a score of 0.05.
Figure VIII.

Male Bias
Male bias: rate at which men relative to women are depicted as more dominant, less submissive, less engaged in domestic affairs, and more physically active. Panels B and C: Conditional on continental FE and baseline controls ln(# of publications) and ln(year of first publication).
Influential research on gender norms links the historical status of women in agriculture to historical gender roles. Boserup (1970), for example, identifies in the use of the plow a diminished role of women. The agricultural roots of gender norms are clear in the examples described above. According to the EA among the Khasi, who did not use the plow historically, women do appreciably more agriculture, whereas the opposite is true among the Kashmiri. Similarly, Chechens in Russia have historically been a plow-using society with men dominating agriculture, whereas farming was historically absent among the Kets. Finally, although none of the indigenous groups had the plow in Brazil, among the Umotina, only men worked in agriculture. Among the Caduveo and the Palikur, women participated at least as much as men did.
We formally explore this pattern in Table VII, Panel C. We use variable v54 from the EA that records sex differences in agriculture and exclude groups for which agriculture is absent or unimportant, that is, v54 equals 9. The independent variable in columns (1) to (3) is an indicator that takes the value 1 when men contribute more than women do to agriculture. In columns (4) to (6), the independent variable takes the value 1 for groups that had the plow before contact with the Europeans. Across and within continents as well in modern-day countries, historically plow-using societies and those where men did most of the agricultural work are communities whose traditional stories have a clear gender bias. Men are dominant and physically active, whereas women are submissive and engage in domestic affairs. In the most conservative specifications in columns (3) and (6), the estimated beta coefficients are about 0.10. Figure VIII, Panels B and C depict the binned residual scatter plots from columns (2) and (4), respectively.
Our work builds on several studies exploring gender norms in specific tales and groups. See, for example, the early contributions by Elder (1968), Upadhyaya (1968), Howe and Hirschfeld (1981), and Weigle (1982), culminating in an exhaustive multivolume encyclopedia on women’s folklore across the globe by Locke, Vaughan, and Greenhill (2009). Our study is the first one in economics and folklore studies to establish econometrically a large-scale association between male bias in folklore and the status of women historically across ethnic groups, and today across countries, and second-generation immigrants. It also offers empirical support to the thesis of famous American folklorist Lewis (1974) regarding the role traditional narratives play (primarily proverbs and jokes) in supporting and maintaining the negative stereotypes about women’s status and teaching such values to the members of society.
VI. Concluding Remarks
Narratives are essential building blocks of our society. We introduce to economics a unique catalog of oral traditions across approximately 1,000 groups. After validating folklore’s content showing that episodes in a group’s oral tradition reflect its geographic and social attributes as articulated in the ethnographic record, we undertake a series of applications illustrating how to extract information from folklore. In the first set, we illustrate how to fill in the gaps and expand on a group’s ethnographic record. In the second set, we discuss how machine learning and human classification methods can help shed light on ancestral norms. Our initial examination indicates a striking consistency between values derived from folklore and contemporary attitudes related to trust, risk-taking, and gender norms. Images and episodes in folklore appear to endure and possibly still shape how individuals perceive the world today.
We view this study as a springboard for further research. The finding that folklore-based measures of the economy and the polity correspond to what we know from ethnographers suggests that we can obtain more precise estimates of a group’s heritage by combining the two sources. Lowering the measurement error in the historical record will allow us to revisit and better understand our societies’ legacies and their consequences. One related idea is to use folklore to fill in the EA and SCCS gaps for the universe of recorded traits along the lines described in Section IV. Moreover, one can use folklore to derive bilateral measures of cultural proximity (see Spolaore and Wacziarg 2009), or explore how different geographical traits and historical events influence the content of oral traditions. For example, what do groups located in malaria-prone regions, fertile territories, or rugged terrains “talk” about? Similarly, what are the distinctive themes in the folklore of groups that have experienced disruptions from slavery, epidemics, forced migrations, and colonization? This approach would allow testing famous conjectures in anthropology including the “culture of honor” proposed by Goldschmidt (1971) and Edgerton (1971) and “the original affluent society hypothesis” by Sahlins (1972).
There is a long list of contemporary values and attitudes in regional and global surveys that we have not covered, including patience, aspirations, reciprocity, attitudes toward violence, strangers, the elderly, the community, the importance of imagination, obedience, independence, hard work, and honesty. We hope that the roadmap provided here can help trace these values in the respective oral traditions. Obtaining folklore-based measures of these attitudes may help us better understand the cultural traits that are stable over time.
Another avenue of future research relates to how motifs and concepts have traveled across oral traditions. Some motifs appear to be universal, whereas others are found in a handful of folklore traditions. Is there a pattern in the content of localized versus universal narratives? Moreover, the multiplicity of characters’ attributes in a given motif and oral tradition (at least as classified by humans) may convey important information about the richness and the ambiguity of the characters’ personality. This within–oral tradition diversity in attitudes may provide a way to gauge the degree of flexibility in the norms transmitted intergenerationally. It would also be interesting to explore how the individual characteristics of those reading and classifying the motifs may systematically predict how a given motif is perceived. Finally, we posit that the degree of continuity in the narratives between contemporary children’s books and the folktales and myths of the respective societies is a direct measure of the rate at which ancestral norms are intergenerationally transmitted.
Given the versatility of folklore as a vehicle for obtaining a unique (and perhaps our only) view of our ancestral cultural heritage, we expect it to be useful to scholars interested in the historical origins of comparative development, social psychology, culture, and beyond.
Supplementary Material
Footnotes
We are extremely grateful to Yuri Berezkin for generously sharing his lifetime work on folklore classification and for clarifying many of its aspects. The editor and three referees offered excellent suggestions. We also thank Alberto Alesina, Elias Papaioannou, Benjamin Enke, Rafael La Porta, Ernesto Dal Bó, Jesse Shapiro, Roland Bénabou, David Weil, Paul Seabright, and Max Winkler for their feedback. Seminar and workshop participants at numerous venues offered many useful suggestions. Kush Bavaria, Vafa Behnam, Prajjwal Bhattarai, Rohit Chaparala, Elizabeth Dimen, Adrien Foutelet, Masahiro Kubo, Xueyun Luo, Zhiyang Luo, Priyanka Panjwani, Zhihan Wang, Mengjia Xia, and Xiaochen Yan provided superlative research assistance. Stelios Michalopoulos is grateful to the Population Studies and Training Center at Brown University, which receives funding from the NIH (P2C HD041020), for general support. Melanie Meng Xue acknowledges financial support from Donorstrust, the Balzan Foundation, and the Center for Economic History at Northwestern University.
See Bénabou, Falk, and Tirole (2018) for a theoretical investigation of the interplay between narratives and moral reasoning. Rodrik (2017) highlights the parallels between the structure of fables and that of economic models.
Attempts to address these issues have been made in the context of specific traits, regions, and periods, but a comprehensive answer is lacking. Algan and Cahuc (2010), for example, use immigrants in the United States over time to uncover trust values for most of the twentieth century, and Voigtlander and Voth (2012) document the persistence of anti-Semitism in Germany. Giuliano and Nunn (forthcoming) show that historical climate shocks weaken the transmission of cultural traits today. Finally, see Chen (2013) and Galor, Ozak, and Sarid (2016) for attempts to link linguistic features regarding, for example, the structure of the future tense to contemporary cultural attributes.
In the Online Appendix, we discuss the promise and pitfalls of applying machine learning techniques to extracting values from folklore. We apply shrinkage methods over thousands of keywords in the folklore catalog to uncover concepts that predict contemporary values as reflected in the Global Preference Survey (GPS) data set of Falk et al. (2018).
Since introducing his catalog in 2015, Berezkin updates the motifs and groups sporadically. We use the October 2019 version. In personal correspondence, he indicated that updating oral traditions for groups in the Americas and Europe is complete. For groups in Africa, Asia, and Oceania, the coverage is higher than  The updates mostly affect small, isolated groups.
Examples of folklore journals include Folk-Lore Journal, Journal of American Folklore, Journal of Latin American Lore, Latin American Indian Literature Journal, Journal of the Polynesian Society, Journal de la Société des Américanistes, Journal of the Anthropological Institute of Great Britain and Ireland, Journal of Indo-European Studies, Journal de la Société Finno-Ougrienne, and Oral Traditions.
Over the past few years, text analysis has seen advances thanks to the abundance of digital text and the development of computing techniques. See Grimmer and Stewart (2013) and Evans and Aceves (2016) for reviews of studies in text analysis in political science and sociology, respectively. Gentzkow, Kelly, and Taddy (2019) provide an excellent entry into the weaknesses and advantages of the available text-analysis methods.
Gentzkow and Shapiro (2010) count the number of newspaper articles containing partisan phrases, whereas Saiz and Simonsohn (2013) enter search queries into Google to obtain document-frequency measures of corruption. Tetlock (2007), Baker, Bloom, and Davis (2016), and Enke (forthcoming), also use a prespecified dictionary of terms.
For instance, Ross, Greenhill, and Atkinson (2013) study the diffusion of 700 variants of the story “The Kind and the Unkind Girls” in Europe. In Berezkin’s work, a single motif, k56 (present in 169 oral traditions), subsumes these numerous variants. This example illustrates the usefulness of a motif as an aggregator of similar themes.
A way to gauge the explanatory power of country-specific features on the coverage of oral traditions is to look at the R2 value from regressing features of Berezkin’s references per group on country fixed effects. Country-specific constants explain around  of the variation in the number of titles per group and year of the first publication across groups.
Here is a publication on the Inuit oral tradition: “Stories of the Black River People. From stories told by Robert (Nasruk) Cleveland of Shungnak (Alaska). Tape-recorded by Don Charles Foote. Transcribed by Minnies (Aliitchak) Gray. Translated and proofread by Ruth (Taqaviñ) Ramoth-Sampson and Angeline (Ipiilik). Newlin Anchorage: University of Alaska (1980).” This example highlights that even in the production of a single publication there are several individuals involved.
The embeddings are a version of ConceptNet Numberbatch. In an ACL 2017 SemEval study, Speer and Lowry-Duda (2017) show that these precomputed vectors are the state of the art in terms of vector representations.
To avoid our results being driven by societies where little is known of their oral tradition, we restrict our attention to groups with at least five motifs. This number coincides with the bottom  of the number of motifs across groups and reduces the sample to 943 societies. The number of observations in the individual regressions may be smaller because of missing geographic information for groups on small remote islands. The patterns are stronger when we weight by the number of motifs per group, effectively allowing the coefficient estimates to be more sensitive to groups with better-sampled oral traditions (results not shown).
We take logs after adding a small number to account for the skewed nature of concept intensity across oral traditions. Results are similar if we use the shares instead of the logarithmic transformation or focus on the extensive margin, that is, an indicator reflecting whether a concept is present.
We use the mean lightning flash rates observed by the spaceborne Optical Transient Detector (OTD) and Lightning Imaging Sensor (LIS) instruments from 1995 to 2010; see Cecil, Buechler, and Blakeslee (2014).
To arrive at the caloric potential the authors calculate for each cell of size 5′ × 5′ the calories per hectare per year that one would attain if they plant the crop that maximizes the caloric yield given the climatic characteristics of the particular area. Therefore, this is not a suitability measure for any specific crop, but it is a measure of a cell’s potential crop yield if planted with the crop that delivers the most calories.
The data we use come from Natural Earth, a public domain map data set that includes a global set of single line drainages of sizable rivers. The original source is the CIA World DataBank II, a collection of world map data created by the U.S. government in the 1980s.
This happens because in the subset of groups with missing values on political complexity, those that rely more on farming are less likely to follow intensive agricultural practices. These two variables correlate positively and strongly in the sample of groups with known political complexity.
The words tagged by punishment are punishment, punish, and retribution. For award the terms are: award, reward, and winner. Finally, for supernatural the related words are: magical, superhuman, supernatural, supernaturally, vampire, and witchcraft. Using the keyword reward instead of award produces similar results.
The related words tagged in the motifs are betray, cheat, deceive, deception, trick, cheater, deceiver, deceit, deceitful, dupe, falsify, hack, hoodwink, unfaithful, cajole, confuse, fool, hoax, stratagem, ruse, and wile.
For 22 out of 281 motifs, the mode was not unique, that is, MTurks were evenly split between two classifications. In these cases, we treated the motifs as indicating both categories.
The religion variable we use is labeled rlddnm and indicates “Religion or Denomination Belonging to at Present.” It includes the following eight denominations: Roman Catholic, Protestant, Eastern Orthodox, other Christian denomination, Jewish, Islamic, Eastern religions, and other non-Christian religions. We complement this classification with an indicator reflecting those that answer “no” to the question of whether they belong to a particular religion or denomination. This is the case for roughly  of the respondents.
The words related to challenges and competitions according to ConceptNet found in the motifs are contest, competition, winner, challenge, challenger, compete, tournament, contender, competitor, confront, dare, difficult, and difficulty.
Data on patents come from the World Intellectual Property Organization Patent Report. The statistics on incorporation rates come from the World Bank’s Entrepreneurship Survey and database.
The variable emplrel in the ESS reflects each respondent’s employment relation in their current job, or their last one, if currently out of work. Self-employment takes the value of 0 if the respondent answers being an employee and 1 if she answers that she is self-employed or working for her own family business.
The words used to identify female characters are: woman, girl, female, wife, lady, mother, daughter, stepmother, grandmother, sister, niece, girlfriend, queen, princess, and for men: man, boy, male, husband, father, son, stepfather, grandfather, brother, nephew, boyfriend, king, and prince.
This pattern is not unique to Berezkin’s work. Karsdorp et al. (2015) note that male and female characters in Thompson’s Motif Index also appear in different themes. Men are prominent in (i) mythological, (ii) magic, (iii) marvels, and (iv) wise and the foolish tales, whereas women dominate the categories (i) deception and (ii) sex.
Our findings echo Towbin et al. (2004). The authors investigate gender representation in fiction stories from the Wattpad online writing community and find male overrepresentation and traditional gender stereotypes (e.g., dominant men and submissive women) are common in nearly every genre in a corpus of 1.8 billion words. Hence, contemporary fiction bears strong parallels to folklore in terms of the representation of gender. It would be interesting to explore whether the oral tradition of the various authors in this online community is predictive of the gender roles in their stories.
Contributor Information
Stelios Michalopoulos, Brown University, Center for Economic Policy and Research, and National Bureau of Economic Research, United States.
Melanie Meng Xue, New York University, Abu Dhabi and London School of Economics, United Kingdom.
Data Availability
Data and code replicating the figures and tables in this article can be found in Michalopoulos and Xue (2021) in the Harvard Dataverse, https://doi.org/10.7910/DVN/IXOHKB.
References
- Akerlof George A., Snower Dennis J., “Bread and Bullets,” Journal of Economic Behavior and Organization, 126 (2016), 58–71. [Google Scholar]
- Alesina Alberto, Giuliano Paola, Nunn Nathan, “On the Origins of Gender Roles: Women and the Plough,” Quarterly Journal of Economics, 128 (2013), 469–530. [Google Scholar]
- Algan Yann, Cahuc Pierre, “Inherited Trust and Growth,” American Economic Review, 100 (2010), 2060–2092. [Google Scholar]
- Baker Scott R., Bloom Nicholas, Davis Steven J., “Measuring Economic Policy Uncertainty,” Quarterly Journal of Economics, 131 (2016), 1593–1636. [Google Scholar]
- Bates Robert H., Essays on the Political Economy of Rural Africa (Berkeley: University of California Press, 1983). [Google Scholar]
- Becker Anke, “On the Economic Origins of Restrictions on Women Sexuality.” Mimeo, Harvard University, 2019. [Google Scholar]
- Bénabou Roland, Falk Armin, Tirole Jean, “Narratives, Imperatives, and Moral Reasoning,” NBER Working Paper no. 24798, 2018. [Google Scholar]
- Bentzen Jeanet Sinding, “Acts of God: Religiosity and Natural Disasters across Subnational World Districts,” Economic Journal, 129 (2019), 2295–2321. [Google Scholar]
- Berezkin Yuri, “Folklore and Mythology Catalogue: Its Lay-out and Potential for Research,” The Retrospective Methods Network Newsletter, 10 (2015a), 58–70. [Google Scholar]
- Berezkin Yuri, “Spread of Folklore Motifs as a Proxy for Information Exchange: Contact Zones and Borderlines in Eurasia,” Trames: Journal of Humanities and Social Sciences, 19 (2015b), 3–13. [Google Scholar]
- Berezkin Yuri, “Peopling of the New World in Light of the Data on Distribution of Folklore Motifs,” in Maths Meets Myths: Quantitative Approaches to Ancient Narratives (Understanding Complex Systems), Kenna Ralph, MacCarron Maírín, MacCarron Pádraig, eds. (Cham: Springer; 2016), 71–89. [Google Scholar]
- Berezkin Yuri, Duvakin Evgeny, “Buried in a Head: African and Asian Parallels to Aesop’s Fable,” Folklore, 127 (2016), 91–102. [Google Scholar]
- Boas Franz, “The Development of Folk-Tales and Myths,” Scientific Monthly, 3 (1916), 335–343. [Google Scholar]
- Boserup Ester, Woman’s Role in Economic Development (London: Allen and Unwin, 1970). [Google Scholar]
- Brown Mary Ellen, “Review Women, Folklore and Feminism,” Journal of Folklore Research, 26 (1989), 259–264. [Google Scholar]
- Cecil Daniel J., Buechler Dennis E., Blakeslee Richard J., “Gridded Lightning Climatology from TRMM-LIS and OTD: Dataset Description,” Atmospheric Research, 135–136 (2014), 404–414. [Google Scholar]
- Chen Keith, “The Effect of Language on Economic Behavior: Evidence from Savings Rates, Health Behaviors, and Retirement Assets,” American Economic Review, 103 (2013), 690–731. [DOI] [PubMed] [Google Scholar]
- Edgerton Robert D. “The Individual in Cultural Adaptation: A Study of Four East African Peoples,” in Studies in Culture and Ecology in East Africa GoldSchmidt Walter, ed. (Berkeley: University of California Press, 1971). [Google Scholar]
- El-Shamy Hasan M., Types of the Folktale in the Arab World: A Demographically Oriented Tale-Type Index (Bloomington: Indiana University Press, 2004). [Google Scholar]
- Elder Jacob D., “The Male Female Conflict in Calypso,” Caribbean Quarterly, 14 (1968), 23–41. [Google Scholar]
- Eldredge Elizabeth, “Women in Production: The Economic Role of Women in Nineteenth-Century Lesotho,” Signs: Journal of Women in Culture and Society, 16 (1991), 707–731. [Google Scholar]
- Enke Benjamin, “Moral Values and Voting,” Journal of Political Economy (forthcoming). [Google Scholar]
- Evans James A., Aceves Pedro, “Machine Translation: Mining Text for Social Theory,” Annual Review of Sociology, 42 (2016), 21–50. [Google Scholar]
- Falk Armin, Becker Anke, Dohmen Thomas, Enke Benjamin, Huffman David, Sunde Uwe, “Global Evidence on Economic Preferences,” Quarterly Journal of Economics, 133 (2018), 1645–1692. [Google Scholar]
- Fenske James, “Ecology, Trade, and States in Pre Colonial Africa,” Journal of the European Economic Association, 12 (2014), 612–640. [Google Scholar]
- Fernandez Raquel, “Does Culture Matter?,” In Handbook of Social Economics, vol. 1A, Benhabib Jess, Jackson Matthew O., Bisin Alberto, eds. (Amsterdam: North-Holland: 2011), 481–510. [Google Scholar]
- Galor Oded, Ozak Omer, “Land Productivity and Economic Development: Caloric Suitability vs. Agricultural Suitability,” Mimeo, Brown University, 2015. [Google Scholar]
- Galor Oded, Ozak Omer, Sarid Assaf, “Geographical Origins and Economic Consequences of Language Structures,” Brown University Working Paper, 2016. [Google Scholar]
- Gentzkow Matthew, Shapiro Jesse M. , “What Drives Media Slant? Evidence from U.S. Daily Newspapers,” Econometrica, 78 (2010), 35–71. [Google Scholar]
- Gentzkow Matthew, Kelly Bryan T., Taddy Matt, “Text as Data,” Journal of Economic Literature, 57 (2019), 535–574. [Google Scholar]
- Giuliano Paola, Nunn Nathan, “Understanding Cultural Persistence and Change,” Review of Economic Studies (forthcoming). [Google Scholar]
- Goldberg Christine, “The Historic-Geographic Method: Past and Future,” Journal of Folklore Research, 21 (1984), 1–18. [Google Scholar]
- Goldschmidt Walter, “Introduction: The Theory of Cultural Adaptation, the Individual in Cultural Adaptation: A Study of Four East African Peoples,” in Studies in Culture and Ecology in East Africa, Goldschmidt Walter, ed. (Berkeley: University of California Press, 1971), 1–22. [Google Scholar]
- Grimmer Justin, Stewart Brandon, “Text as Data: The Promise and Pitfalls of Automatic Content Analysis Methods for Political Texts,” Political Analysis, 21 (2013), 267–297. [Google Scholar]
- Harari Yuval Noah, Sapiens: A Brief History of Humankind (New York: HarperCollins, 2015). [Google Scholar]
- Howe James, Hirschfeld Lawrence A., “The Star Girls’ Descent: A Myth about Men, Women, Matrilocality and Singing,” Journal of American Folklore, 94 (1981), 292–322. [Google Scholar]
- Jason Heda, “The Russian Criticism of the Finnish School in Folktale Scholarship,” Norveg, 14 (1970), 285–294. [Google Scholar]
- Karsdorp Folgert, van der Meulen Marten, Meder Theo, van den Bosch Antal, “MOMFER: A Search Engine of Thompson Motif-Index of Folk Literature,” Folklore, 126 (2015), 37–52. [Google Scholar]
- Lauzen Martha M., Dozier David M., Horan Nora, “Constructing Gender Stereotypes through Social Roles in Prime-Time Television,” Journal of Broadcasting & Electronic Media, 52 (2008), 200–214. [Google Scholar]
- Lewis Mary Ellen, “The Feminists Have Done It: Applied Folklore,” Journal of American Folklore, 87 (1974), 85–87. [Google Scholar]
- Locke Liz, Vaughan Theresa A., Greenhill Pauline, Encyclopedia of Women’s Folklore and Folklife (Westport, CT: Greenwood Press, 2009). [Google Scholar]
- Michalopoulos Stelios, Naghavi Alireza, Prarolo Giovanni, “Trade and Geography in the Spread of Islam,” Economic Journal, 128 (2018), 3210–3241. [DOI] [PMC free article] [PubMed] [Google Scholar]
- Michalopoulos Stelios, Papaioannou Elias, “Introduction: Historical Legacies and Contemporary Development,” in The Long Economic and Political Shadow of History, vol. 1: A Global View (London: VoxEU, 2017), viii–xxix. [Google Scholar]
- Michalopoulos Stelios, Meng Xue Melanie, “Replication Data for: ‘Folklore’,” (2021), Harvard Dataverse, 10.7910/DVN/IXOHKB. [DOI] [Google Scholar]
- Mullainathan Sendhil, Spiess Jann, “Machine Learning: An Applied Econometric Approach,” Journal of Economic Perspectives, 31 (2017), 87–106. [Google Scholar]
- Murdock George Peter, Ethnographic Atlas: A Summary (Pittsburgh: University of Pittsburgh Press, 1967). [Google Scholar]
- Nunn Nathan, “The Historical Roots of Economic Development,” Science, 367 (2020), eaaz9986. [DOI] [PubMed] [Google Scholar]
- Putterman Luis, Weil David N., “Post-1500 Population Flows and the Long-Run Determinants of Economic Growth and Inequality,” Quarterly Journal of Economics, 125 (2010), 1627–1682. [DOI] [PMC free article] [PubMed] [Google Scholar]
- Qian Nancy, “Missing Women and the Price of Tea in China: The Effect of Sex-Specific Earnings on Sex Imbalance,” Quarterly Journal of Economics, 123 (2008), 1251–1285. [Google Scholar]
- Rodrik Dani, “Economics as Narratives.” Mimeo, Harvard University, 2017. [Google Scholar]
- Ross Robert M., Greenhill Simon J., Atkinson Quentin D., “Population Structure and Cultural Geography of a Folktale in Europe,” Proceedings of the Royal Society B, 280 (2013), 20123065. [DOI] [PMC free article] [PubMed] [Google Scholar]
- Sahlins Marshall, Stone Age Economics (Chicago: Aldine, 1972). [Google Scholar]
- Saiz Albert, Simonsohn Uri, “Proxying for Unobservable Variables with Internet Document-Frequency,” Journal of the European Economic Association, 11 (2013), 137–165. [Google Scholar]
- Schaller Mark, Norenzayan Ara, Heine Steven, Yamagishi Toshio, Kameda Tatsuya, Evolution, Culture, and the Human Mind (East Sussex: Psychology Press, 2010). [Google Scholar]
- Shiller Robert J., “Narrative Economics,” American Economic Review, 107 (2017), 967–1004. [Google Scholar]
- Silva Sara, Jamshid Tehrani, “Comparative Phylogenetic Analyses Uncover the Ancient Roots of Indo-European Folktales,” Royal Society Open Science, 3 (2016), 150645. [DOI] [PMC free article] [PubMed] [Google Scholar]
- Speer Robert, Lowry-Duda Joanna, “Conceptnet at Semeval-2017 Task 2: Extending word Embeddings with Multilingual Relational Knowledge,” preprint arXiv:1704.03560, 2017. [Google Scholar]
- Spolaore Enico, Wacziarg Romain, “The Diffusion of Development,” Quarterly Journal of Economics, 124 (2009), 469–529. [Google Scholar]
- Tetlock Paul C., “Giving Content to Investor Sentiment: The Role of Media in the Stock Market,” Journal of Finance, 62 (2007), 1139–1168. [Google Scholar]
- Towbin Mia Adessa, Haddock Shelley A., Schindler Zimmerman Toni, Lund Lori K., Renee Tanner Litsa, “Images of Gender, Race, Age, and Sexual Orientation in Disney Feature-Length Animated Films,” Journal of Feminist Family Therapy, 15 (2004), 19–44. [Google Scholar]
- Upadhyaya Hari S., “Mother-Daughter Relationship Patterns in the Hindu Joint Family: A Study Based on the Analysis of the Bhojpuri Folksongs of India,” Folklore, 79 (1968), 217–226. [Google Scholar]
- Voigtlander Nico, Voth Hans-Joachim, “Persecution Perpetuated: The Medieval Origins of Anti-Semitic Violence in Nazi Germany,” Quarterly Journal of Economics, 127 (2012), 1339–1392. [Google Scholar]
- Weigle Marta, Spiders and Spinsters Women and Mythology (Albuquerque: University of New Mexico Press, 1982). [Google Scholar]
- Whitehouse Harvey, Francois Pieter, Savage Patrick E., Currie Thomas E., Feeney Kevin C., Cioni Enrico, Purcell Rosalind, Ross Robert M., Larson Jennifer, Baines John, ter Haar Barend, Covey Alan, Turchin Peter, “Complex Societies Precede Moralizing Gods throughout World History,” Nature, 568 (2019), 226–229. [DOI] [PubMed] [Google Scholar]
- Xue Melanie, “High-Value Work and the Rise of Women: The Cotton Revolution and Gender Equality in China.” Mimeo, 2016. [Google Scholar]
Associated Data
This section collects any data citations, data availability statements, or supplementary materials included in this article.
Supplementary Materials
Data Availability Statement
Data and code replicating the figures and tables in this article can be found in Michalopoulos and Xue (2021) in the Harvard Dataverse, https://doi.org/10.7910/DVN/IXOHKB.