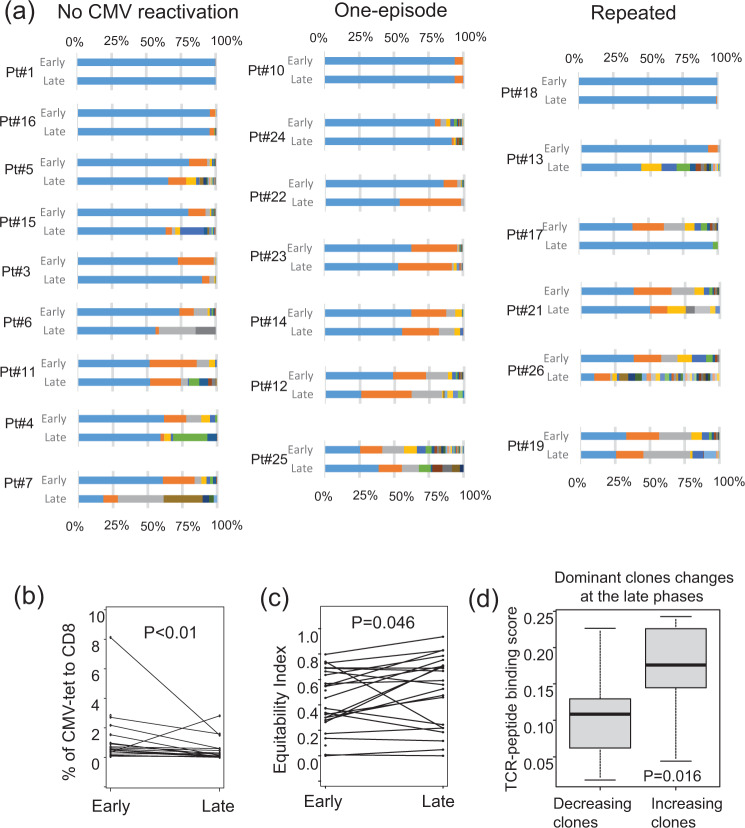
Fig. 3. Changes in proportions and diversity of all HLA-A24-restricted CMV-pp65-specific cytotoxic T-cell (CMV-CTL) clones.
a Changes in the proportions of individual CMV-CTL clones between the early and late phases after allo-HCT in each patient for whom samples were available at both points (n = 22). The same colors suggest the same CMV-CTL clones between the phases within individual patients. b Changes in the proportions of CMV-CTLs in all groups pooled between the early and late phases of allo-HCT (P < 0.001 by Wilcoxon’s signed-rank test). c Changes in Shannon’s equitability index of CMV-CTLs in all groups pooled between the early and late phases of allo-HCT (P = 0.046 by Wilcoxon’s signed-rank test). d Difference in TCR-binding scores of the dominant CMV-CTLs, which accounted for >35% of all CMV-CTLs within individual recipients in the early or late phases after allo-HCT, between the decreasing and increasing clones at the late phases (P = 0.016 by the Mann–Whitney test). Individual box and whisker plots were constructed by the 25th percentile (Q1), median, and 75th percentile (Q3) with whiskers of 1.5 times interquartile range (IQR) lengths.

