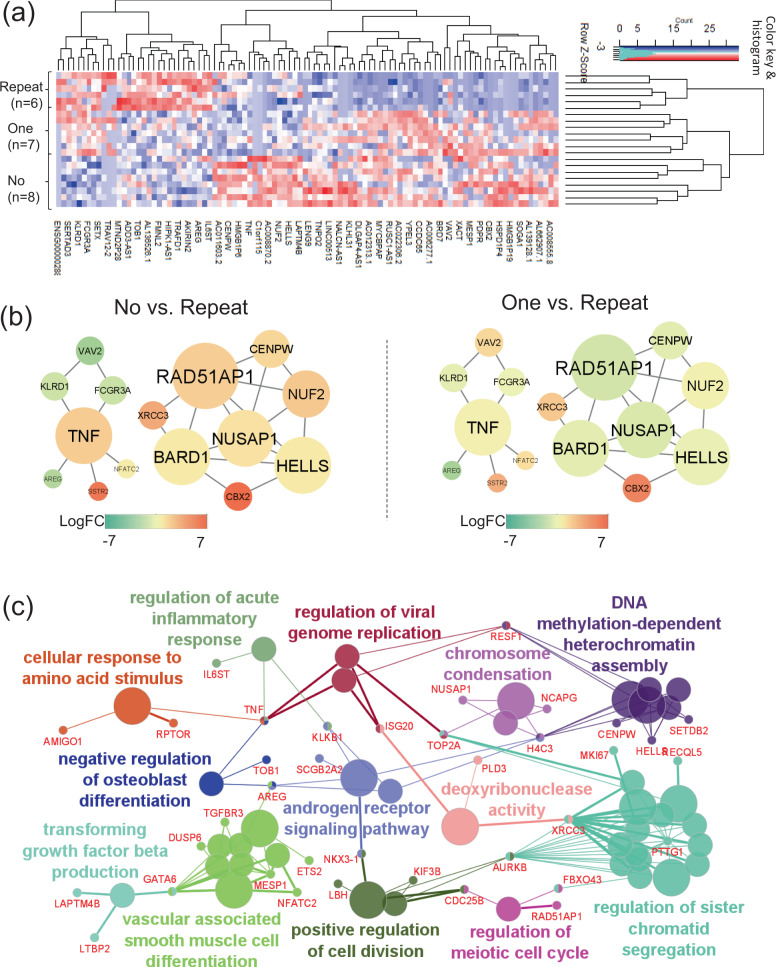
Fig. 5. Gene expression profile (GEP), protein–protein interaction (PPI) network, and gene ontology (GO) enrichment analyses in HLA-A24-restricted CMV-pp65-specific cytotoxic T-cells (CMV-CTL) according to the CMV reactivation pattern in the early phase of allo-HCT.
a A clustering heatmap of GEP using the top 100 differentially expressed genes (DEGs) according to the CMV-reactivation pattern: no-CMV reactivation (no-group, n = 8), one-episode of CMV reactivation (one-group, n = 7), and repeated episodes of CMV reactivation (repeated-group, n = 6). b PPI network constructed by the top 100 DEGs which had close connections with each other. The shape size suggests the degree of centrality of the PPI network, meaning how many edges are connected to each gene node. The heat color denotes the log-fold changes in individual gene expression between the no- vs. repeated- groups or between the one- vs. repeated groups. Only the networks with ≥5 connections are shown. c GO and the shared genes derived from the top 200 DEGs. Each circle denotes an identified term with a P-value of <0.05 without the Bonferroni correction. The same colors mean GO terms that belong to the same GO term-tree groups. Only the names of the leading GO terms with highest significance in each GO term-tree group are shown.

