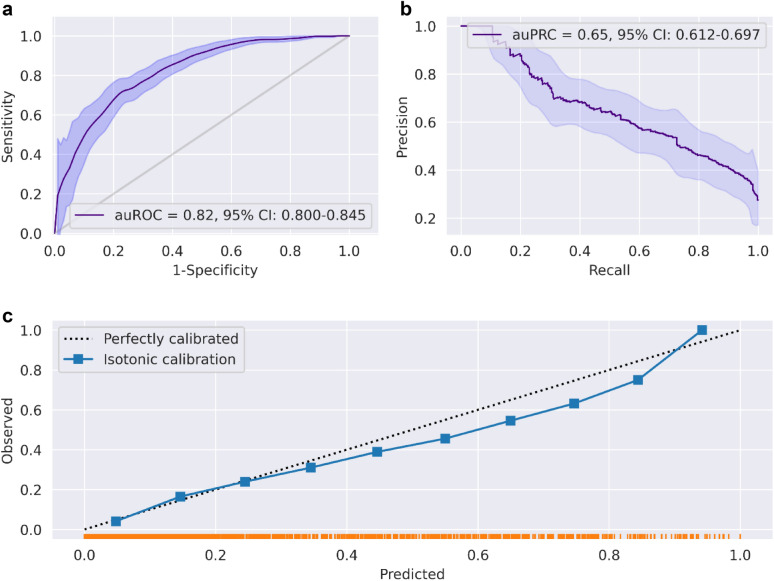
Figure 3.
Performance of the inclusive model (a). Receiver-operating characteristics (ROC) curves for predictions of the inclusive model on the prospective test set. The light band around the curve represents pointwise 95% confidence intervals derived by bootstrapping. (b) A plot of the precision (positive predictive value, PPV) against the recall (sensitivity) of the predictor for different thresholds. The light band around the curve represents pointwise 95% confidence intervals derived by bootstrapping. (c) Calibration plot, plotting the observed outcome against the predicted probabilities. The diagonal gray line represents perfect calibration. A smoothed line is fit to the curve, and points are drawn to represent the averages in ten discretized bins. The rug under the plot illustrates the distribution of predictions.

