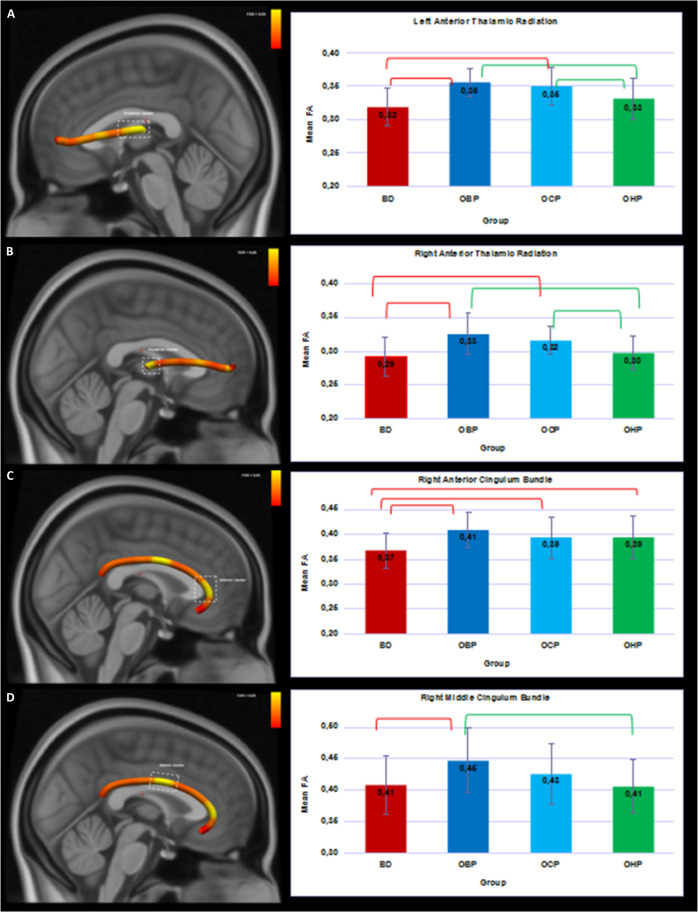
Fig. 1. 3D visualization of the white matter tracts showing group differences across four groups (BD, OBP, OCP, and OHP).
Bar plots represent the mean FA with the main effect of group (FDR-corrected) in four clusters. Red brackets show significant differences in BD versus other groups (q < 0.05). Green brackets show significant differences in OHP versus other groups (q < 0.05). Error bars represent standard deviations. BD—offspring with BD; OBP—offspring of bipolar parents; OCP—offspring of comparison parents; OHP - healthy offspring of healthy parents. A Left Anterior Thalamic Radiation. B Right Anterior Thalamic Radiation. C Anterior cluster of the Right Cingulum Bundle. D Middle cluster of the Right Cingulum Bundle.

