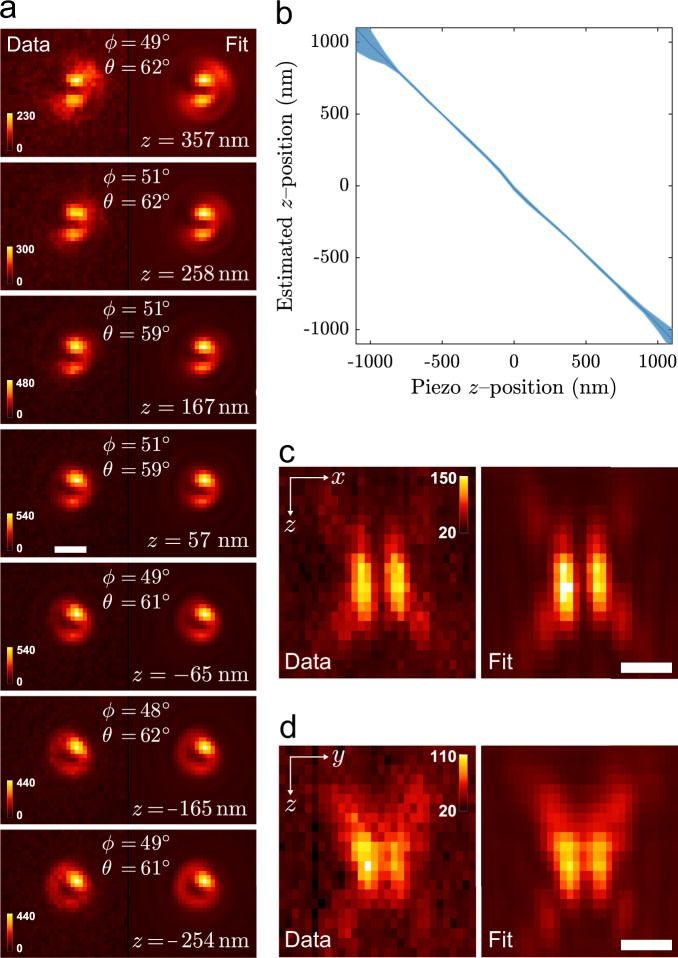
Fig. 2. Vortex PSF validation.
a Vortex PSF model fitted to an experimental z-stack of one single molecule with its estimated parameters listed in each frame. All sub-image pairs are contrast stretched with the same factor for better visibility of the PSF shape and the color bars are in units of photons per pixel. The mean signal count in the frames is 25 × 103 with a standard deviation of 4 × 10³ and a mean background of 24 counts per pixel. The mean degree of orientational constraint of this molecule is g2 = 0.92 with standard deviation of 0.02. b Mean estimated z position as a function of the piezo z position with the shaded region representing ± one standard deviation. The average is taken from 37 single molecules of varying orientations where the piezo z is realigned in processing to account for the in-focus position not corresponding exactly with zpiezo = 0. The slope is negative due to the opposing definition of zpiezo and the sample z. c The cross-section in x−z and d y−z of a Vortex PSF, with the measurement left and fit right (pixels are stretched proportionally in z, color bar units: photons per pixel). The estimated signal photon counts were in the range 4 × 10³−50 × 103, and the estimated background photon counts were in the range 10−40 photons per pixel. All scale bars are 500 nm.

