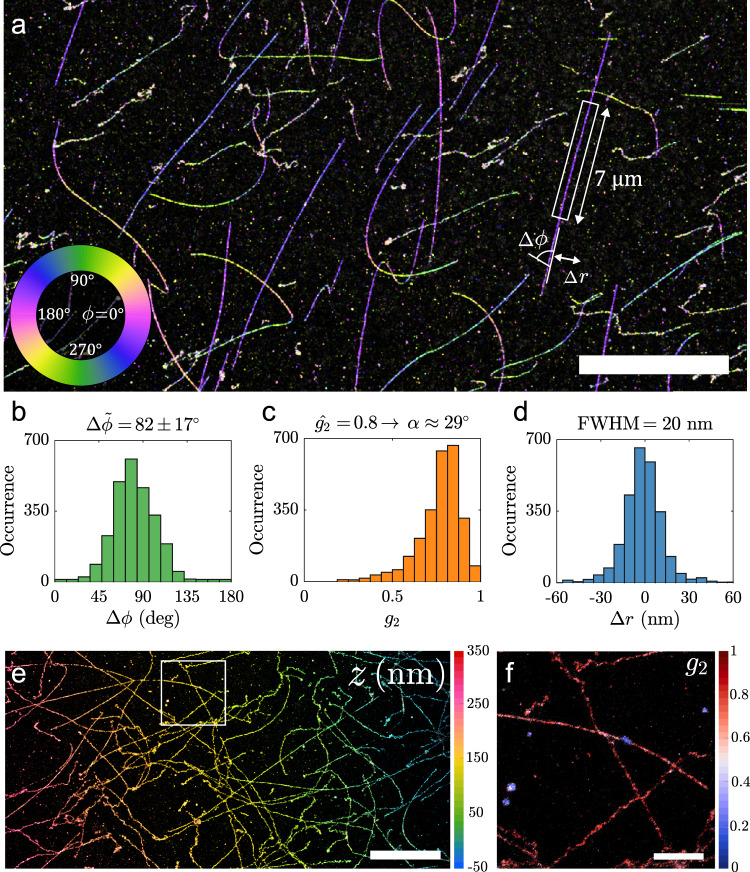
Fig. 4. Super-resolution image of λ-DNA.
a λ-DNA colorized as a function of the azimuthal angle. b Relative azimuthal angle histogram (Δϕ) with respect to the DNA axis from the strand highlighted in a (Δϕ = 82°, MAD(Δϕ) = 17°). c Distribution of g2 from the same strand, the fitted peak g2 = 0.8 corresponds to a wobble cone semi-angle α = 29°. d Position deviation from the spline fit to the DNA axis with a Full-Width Half-Maximum (FWHM) of 20 nm (Filtered to 35° ≤ θ ≤ 145°). e Tilted λ-DNA sample colorized as a function of z-position. f λ-DNA from highlighted region in e, colorized as a function of g2. Scale bars are a 10 μm, e 5 μm, and f 1 μm. These experiments were repeated with similar results (N > 10).

