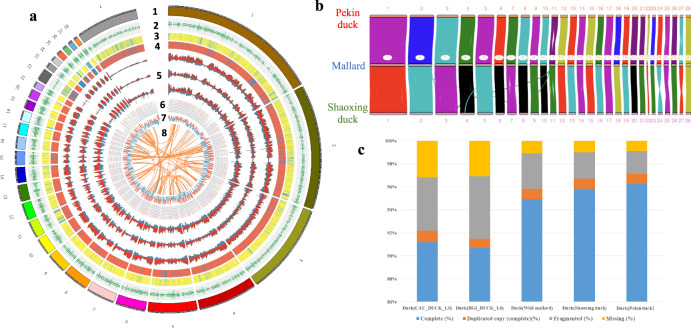
Fig. 1. Overview of the assembly quality and characteristics of the duck genome.
a Chromosomal features of three duck genomes with the integration of genetics (from Chr1 to Chr25). 1: Chromosomal length of Mallard genome (Mb); 2: Gene density (100 kb window); 3: Genome collinearity of Shaoxing duck to Mallard, yellow represents the same orientation, blue represents contrary; 4: Genome collinearity of Pekin duck to Mallard, red represents the same orientation, blue represents contrary; 5: the density of SNP and Indels for Mallard, Shaoxing duck and Pekin duck in the reference Mallard genome (100 kb window). Red represents SNP, and blue represents InDels; 6: The distribution of ATAC-seq windows (100 kb window) in fat tissue; 7: The A/B compartments in Mallard genome. 8:The inner lines show syntenic blocks within the Mallard genome. b The genome collinearity of the genes among the three assemblies. c The 2,586 highly conserved genes in BUSCO dataset were used to search Mallard, Shaoxing duck and Pekin duck genomes. This analysis was carried out with the BUSCO program (version 2) with default settings. BGI_duck_1.0 and CAU_duck_1.0 are genome assemblies of Pekin duck downloaded from Genebank accessions GCA_002743455.1 and GCA_000355885.1, respectively.

