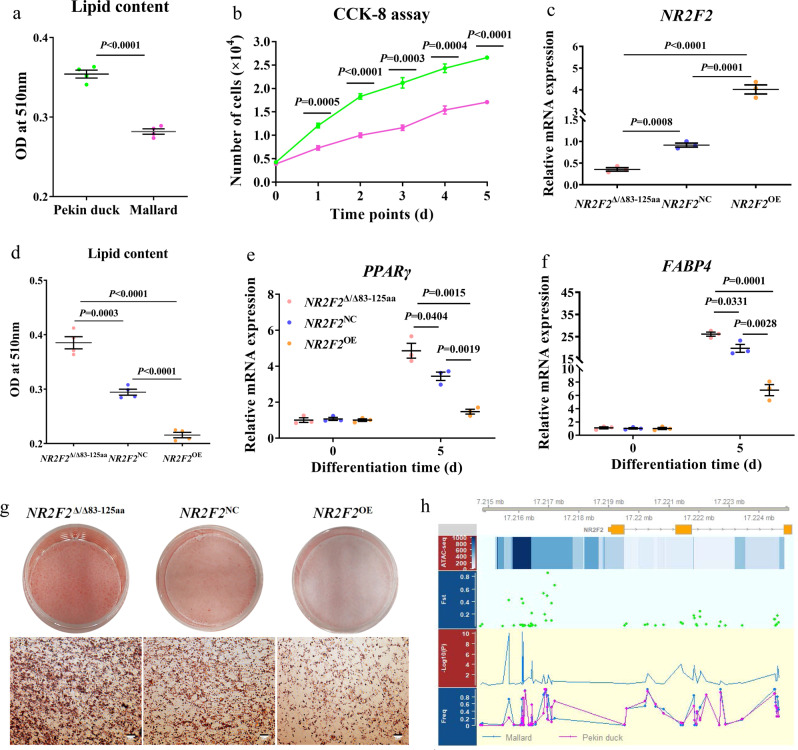
Fig. 3. Comparison of differentiation and proliferation capacity in subcutaneous preadipocytes between Pekin duck and Mallard.
a Intracellular lipid content in subcutaneous preadipocytes of Pekin duck and Mallard at day 5 post induction. The oil red O extraction assay was used to measure lipid accumulation. Green: Pekin duck and pink: mallard (n = 4 biological replicates). b Cell counting kit-8 assay (CCK8) examines the proliferation of subcutaneous preadipocytes in Pekin duck and Mallard over 5 days. Each cell number is counted by the standard curve established by CCK8 of the respective cells (n = 4 biological replicates). c mRNA levels of NR2F2 were analyzed by Q-PCR in NR2F2NC, NR2F2OE, and NR2F2Δ/Δ83-125aa cells. NC negative control, OE overexpression, Δ deleted (n = 3 biological replicates). d Intracellular lipid content in preadipocytes at day 5 post induction. The oil red O extraction assay was used to measure the lipid accumulation (n = 4 biological replicates). e, f mRNA levels of PPARγ and FABP4 were analyzed by Q-PCR at day 0 and 5 post induction (n = 3 biological replicates). g Oil Red O staining to assess lipid accumulation at day 5 post induction for NR2F2NC, NR2F2OE, and NR2F2Δ/Δ83-125aa cells. The scale bar represents 20 μm (n = 4 biological replicates). h The distribution of SNPs with a different frequency in NR2F2 for Pekin duck and Mallard populations. The track below the transcript annotation represents the windows of ATAC-seq. The color depth represents the peak score size. The following tracks are shown separately: Fixation index, −log10 (p-value of likelihood ratio test), and allele frequency. Data are presented as mean ± SEM. Statistical significance using two-tailed unpaired Students t-test for (a–f).

