
Figure 3.
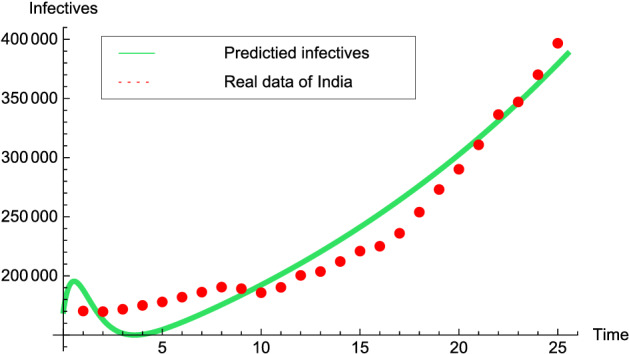
Graph illustrating the validation of model system to the real data of India for the time interval March/01-March/25/2021: Red dots and Green solid line depict the real data and predicted trajectory, respectively, for the model system (2).
Official websites use .gov
A
.gov website belongs to an official
government organization in the United States.
Secure .gov websites use HTTPS
A lock (
) or https:// means you've safely
connected to the .gov website. Share sensitive
information only on official, secure websites.
Graph illustrating the validation of model system to the real data of India for the time interval March/01-March/25/2021: Red dots and Green solid line depict the real data and predicted trajectory, respectively, for the model system (2).