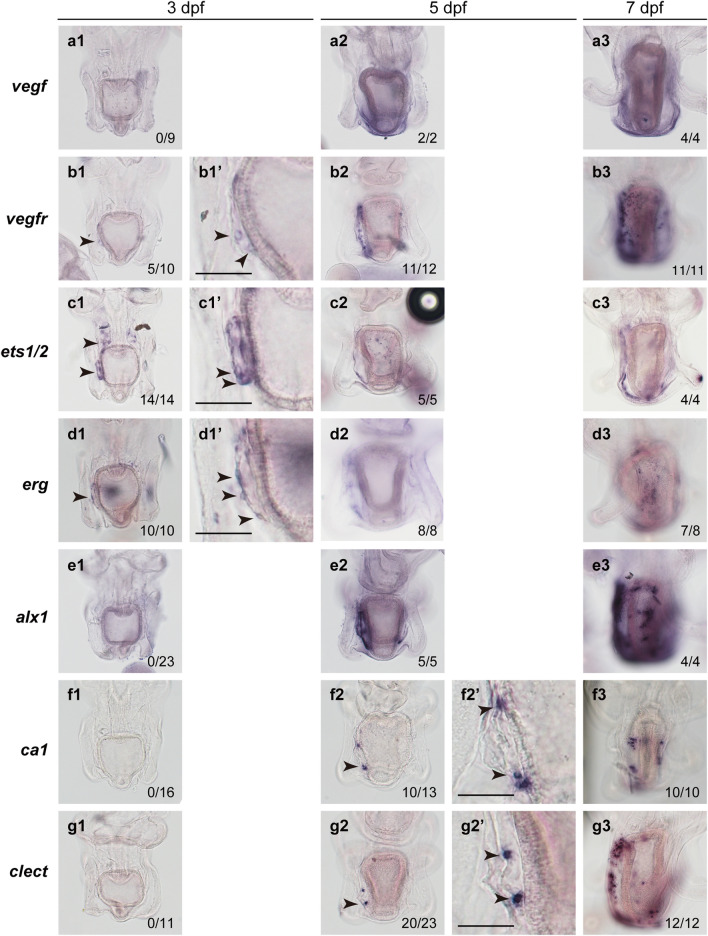
Figure 2.
Expression of skeletogenesis-related genes in starfish larvae. Expression patterns of vegf (a1–a3), vegfr (b1–b3), ets1/2 (c1–c3), erg (d1–d3), alx1 (e1–e3), ca1 (f1–f3), and clect (g1–g3) were examined at 3 dpf (a1–g1, b1’–d1’), 5 dpf (a2–g2, f2’, g2’), and 7 dpf (a3–g3) by whole-mount in situ hybridization (WMISH). The numbers shown in the lower right corner of each image indicate the number of larvae showing a positive WMISH signal among the larvae examined. Arrowheads indicate the regions or cells expressing each gene. Enlarged images are shown in (b1’–d1’, f2’, g2’). See details in the text. Scale bars: 50 μm.

