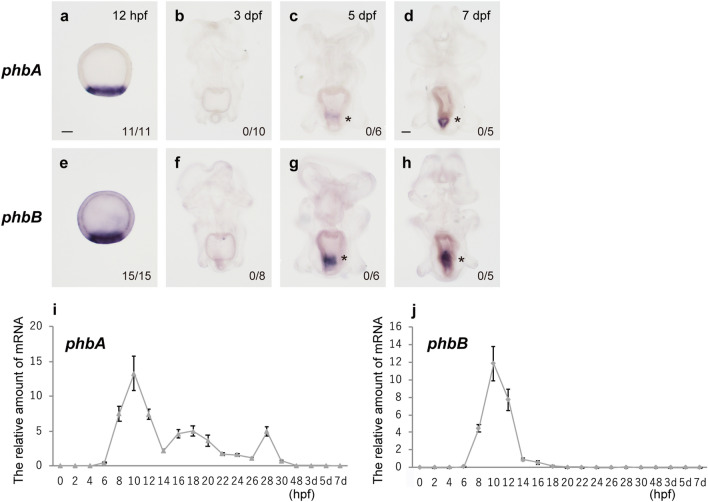
Figure 6.
Expression of phbA and phbB in the starfish. The expression of phbA and phbB was examined by WMISH (a–h) and quantitative PCR (qPCR; i and j). (a–h) The number in the lower right corner shows the number of embryos or larvae showing a positive WMISH signal/the total number examined. Asterisks indicate nonspecific signals for phb genes (see “Methods”). (i, j) The X-axis shows the time after fertilization, and the Y-axis shows the mRNA amounts of phbA (i) and phbB (j) relative to that of EF1α. Data are shown as the mean ± standard deviation. Scale bars: 50 μm.

