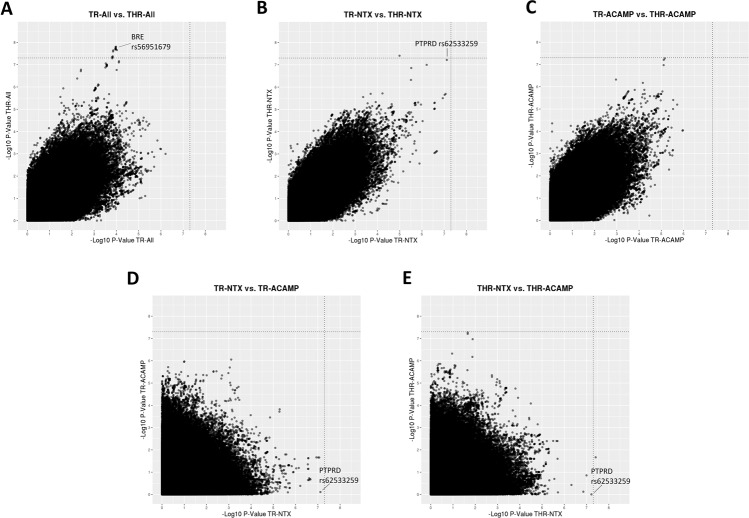
Fig. 2. Scatterplots comparing results (p values) from GWAS of TR vs. THR and comparing results of analyses of different patient subsets.
Scatterplots of -log(p) for (A) analysis of TR vs. analysis of THR in all subjects, (B) analysis of TR vs. analysis of THR in naltrexone-treated subjects, (C) analysis of TR vs. analysis of THR in acamprosate-treated subjects, (D) analysis of TR in acamprosate-treated patients vs. analysis of TR in naltrexone-treated patients, and (E) analysis of THR in acamprosate-treated patients vs. analysis of THR in naltrexone-treated patients.

