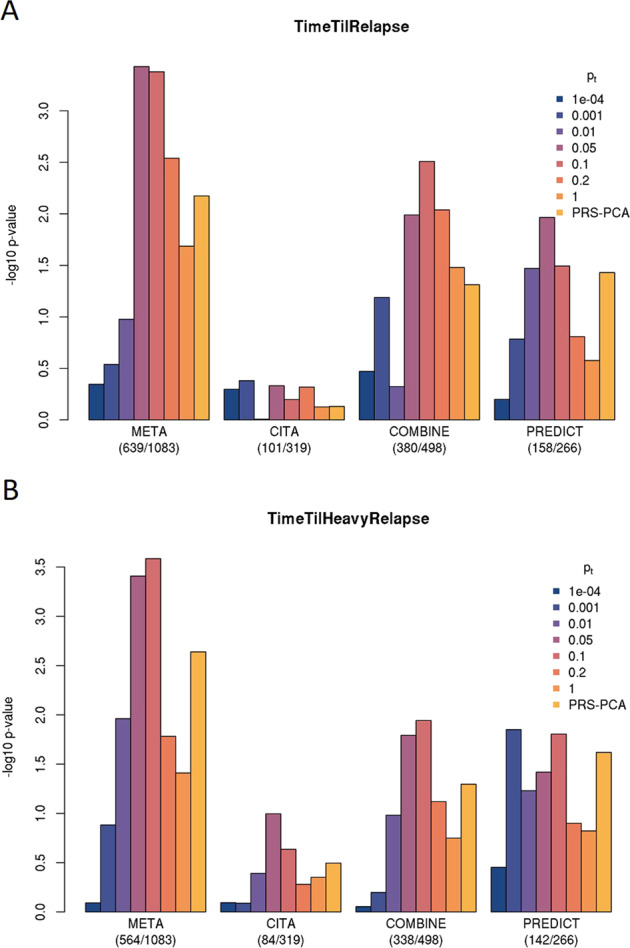
Fig. 3. Leave-one-out PRS analyses.

Leave-one-out PRS analysis of (A) time until relapse to any drinking and (B) time until relapse to heavy drinking. In each of the three studies (CITA, COMBINE and PREDICT) PRSs were constructed based on a discovery GWAS in the remaining two samples across a range of p value thresholds (pT denoted using different colors described in the legend) to select SNPs for inclusion in the PRS. The selected SNPs (after LD pruning) were used to compute PRSs and the association of the PRSs with the outcome (TR or THR) was tested. The plots show the –log10(p values) for these association tests (on the y-axis) in each sample, as well as the meta-analysis of the leave-one-out PRS associations across the studies. The PRS association meta-analyses provided significant results for both time until relapse (p = 3.7E−04, Nagelkerke’s R2 = 1.3% at pT = 0.05) and time until heavy relapse (p = 2.6E−04, Nagelkerke’s R2 = 1.3% at pT = 0.10).
