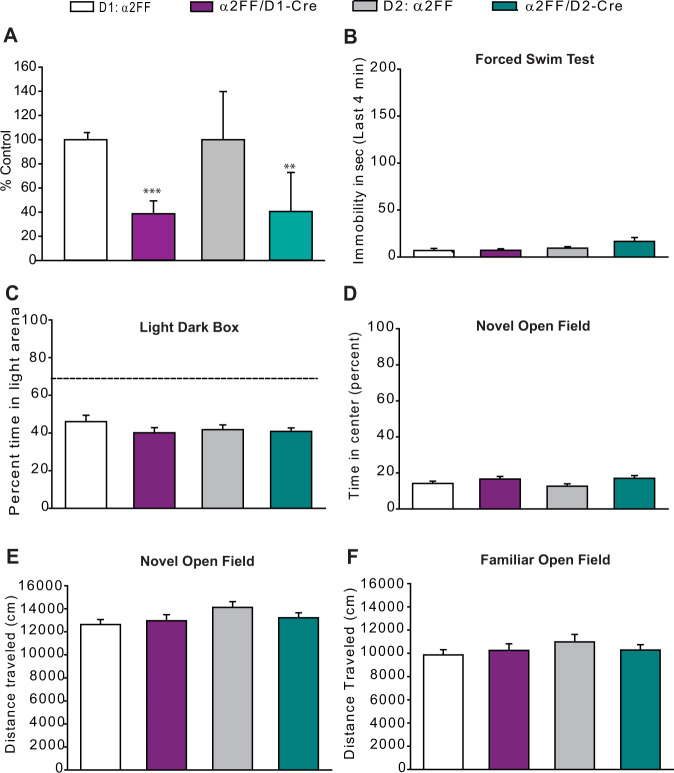
Fig. 4. Molecular and behavioral characterization of D1+ and D2+ conditional knockdown of α2-GABAARs.
A Decreases in Gabra2 expression are detected in the NAc of α2FF/D1-Cre (n = 5) compared to littermate control α2FF mice (n = 4) and α2FF/D2-Cre mice (n = 6) compared to littermate control α2FF mice (n = 5) (t test, α2FF vs. α2FF/D1-Cre, ***p < 0.001; α2FF vs. α2FF/D2-Cre, **p < 0.01). B In the forced swim test α2FF/D1-Cre, α2FF/D2-Cre, and their respective littermate α2FF controls spend little time immobile in the last 4 min of the test (one-way ANOVA, F1,58 = 1.824, p > 0.05; D1 α2FF n = 14, α2FF/D1-Cre n = 14, D2 α2FF n = 17, α2FF/D2-Cre n = 17). C In the light–dark box test, α2FF/D1-Cre, α2FF/D2-Cre, and their respective littermate α2FF controls spend a similar percentage of time in the lit chamber (one-way ANOVA, F1,58 = 1.134, p > 0.05; D1 α2FF n = 14, α2FF/D1-Cre n = 14, D2 α2FF n = 18, α2FF/D2-Cre n = 16). The dashed line represents the percentage time in the light chamber that would be expected if the distribution of time between the light and dark chambers were random (67%, chance level). D, E In the novel open field, α2FF/D1-Cre, α2FF/D2-Cre, and their respective littermate α2FF controls spend a similar percentage of time in the center portion of the chamber (one-way ANOVA, F1,44 = 2.204, p > 0.05) and move a similar distance (one-way ANOVA, F1,44 = 1.535, p > 0.05). D1 α2FF n = 11, α2FF/D1-Cre n = 13, D2 α2FF n = 10, α2FF/D2-Cre n = 14). F In the familiar open field, α2FF/D1-Cre, α2FF/D2-Cre, and their respective littermate α2FF controls travel a similar total distance (Kruskal–Wallis one-way ANOVA on Ranks H = 1.504, p > 0.05; D1 α2FF n = 14, α2FF/D1-Cre n = 15, D2 α2FF n = 15, α2FF/D2-Cre n = 17).

