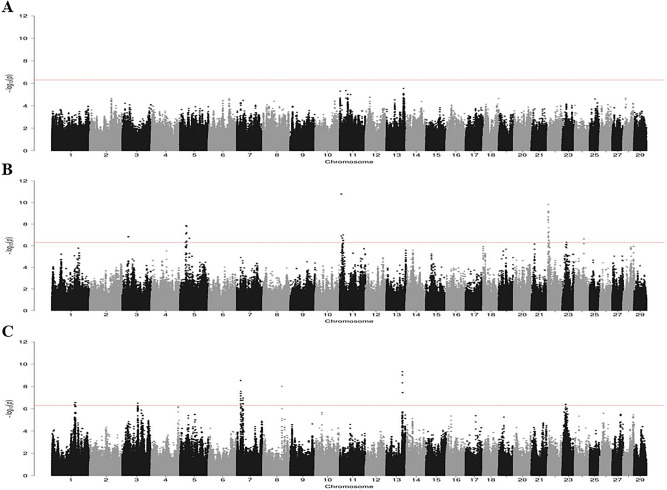
Figure 1.
Manhattan plots showing –log10(P values) of association between every single SNP and phenotype. Each dot represents the result from the test association for a single SNP. Animals were considered cases when they had focal (A), multifocal (B) or diffuse (C) lesions. Chromosomes localization of the SNPs associated with each type of lesion is indicated on the x-axis. The red horizontal line is drawn at − log10 (5 × 10⁻⁷) to show the high level of significance.

