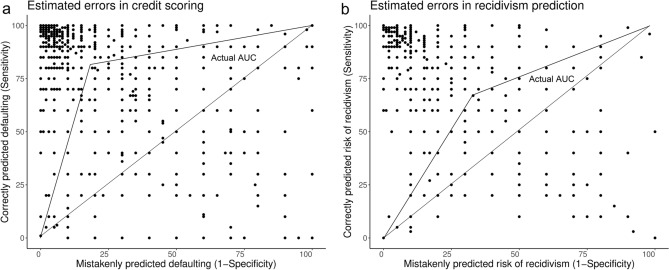
Figure 2.
(a,b) Respondents overestimate the accuracy of algorithms for credit scoring and recidivism prediction. The scatterplots show each respondent’s estimates of the false positive rate (1—specificity) and false negative rate (shown as its complement, the sensitivity) in credit scoring (n = 2740) and in recidivism prediction (n = 1325). Each point corresponds to one respondent. The triangles frame the areas under the simplified ROC curves for actual credit scoring accuracy (SCHUFA Credit Score algorithm, AUC = 0.81) and for recidivism prediction (COMPAS algorithm, AUC = 0.68).

