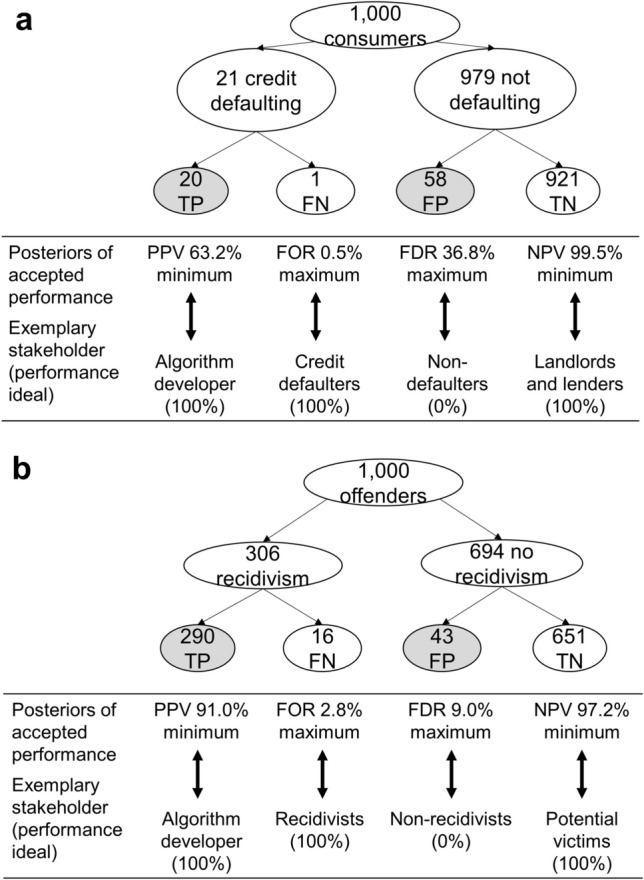
Figure 3.

(a,b) Natural frequency trees45 of algorithm error acceptance for base rates of 2.1% credit defaulters (a) and of 30.6% recidivists (b), and comparison of minimum performance acceptance (posterior probabilities) of respondents with performance ideals of exemplary stakeholders. Posteriors shown are the acceptable minimum PPV (positive predictive value; e.g. that a person will commit another crime if testing positive), minimum NPV (negative predictive value: e.g. that a person will not commit another crime if testing negative), maximum FOR (false omission rate = 1-NPV), and maximum FDR (1—PPV); TP (true positive), TN (true negative), FP (false positive), FN (false negative). Note that averages of posteriors that were calculated on the individual level are not equal to posteriors based on aggregated TPs, FPs, TNs, and FNs.
