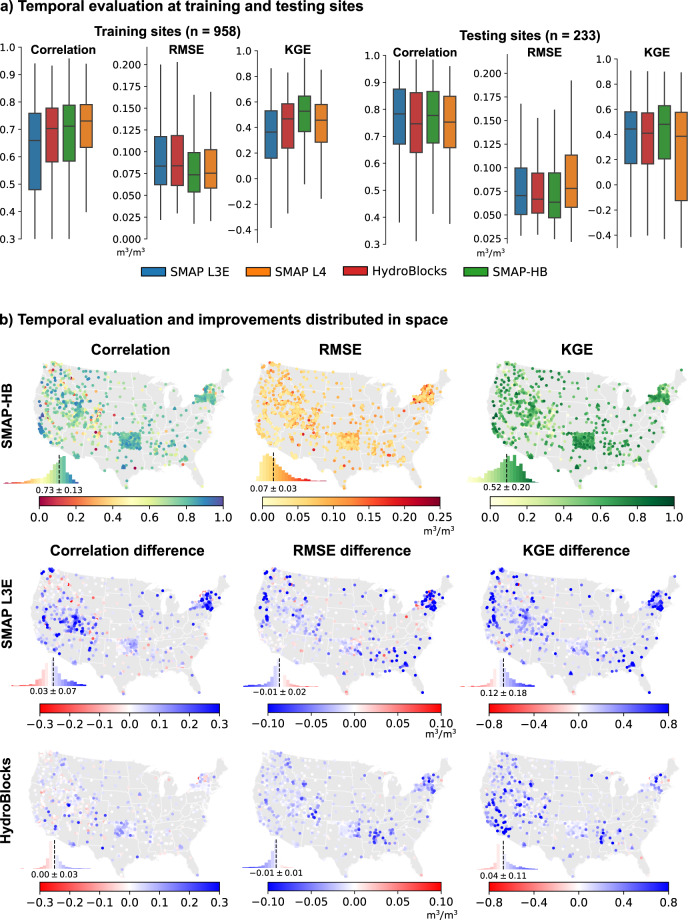
Fig. 2.
Temporal evaluation of daily SMAP L3E, SMAP L4, HydroBlocks, and SMAP-HB soil moisture products against in-situ observations. Evaluation statistics are the Pearson correlation, RMSE, and the KGE score. Panel (a) shows the temporal evaluation analysis split between in-situ observations used in the merging scheme random forest model (training sites, Table S1) and independent observations (the SMAP core calibration/validation sites). The in-situ observations were compared with the respective soil moisture product when data was simultaneously available for all four products, where n is the number of observational sites evaluated. To remove the influence of frozen soils, observations are masked when the HydroBlocks soil temperature is below 4 °C. Panel (b) shows the temporal statistics of the SMAP-HB product distributed in space and their respective improvement over those for the base products. The first row shows the correlation, RMSE, and KGE for SMAP-HB for all the sites. The following rows show the difference in the evaluation statistics between SMAP-HB and the base products. Blue colors indicate higher SMAP-HB performance. Inset histograms show the median and median absolute deviation values.

