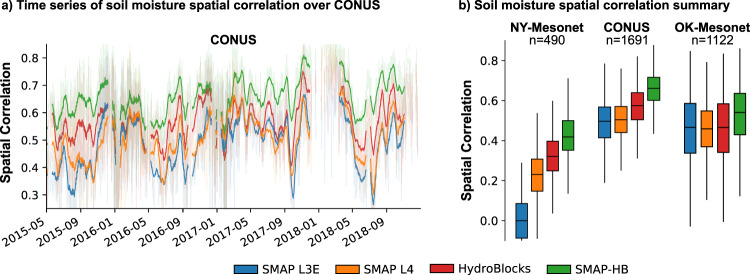
Fig. 3.
Soil moisture spatial correlation. The spatial correlation was calculated for each day by comparing the soil moisture products at collocated grid cells with the in-situ observations over the CONUS, New York Mesonet, and Oklahoma Mesonet. This was done when at least 60 in-situ observations were available simultaneously at each time step. Panel (a) shows the time series of the CONUS spatial correlation. For clarity, we used a seven-day moving average. Panel (b) shows the summary statistics of the daily spatial correlation for each region, with n as the number of days evaluated in each comparison.

