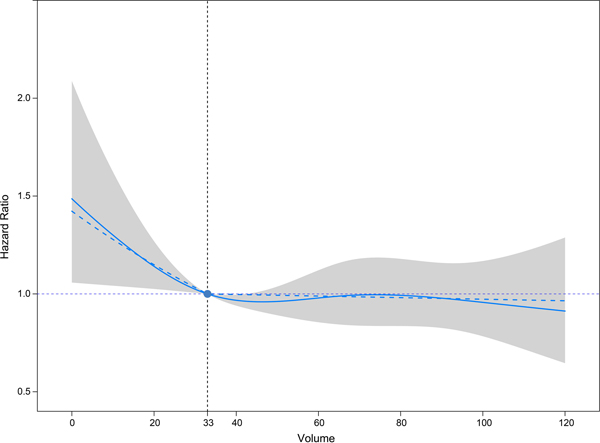
Figure 2.
Volume Outcome Curve Demonstrating Relationship Between Annual Transplant Center Volume and Hazard of Post-Transplant Mortality Within One Year (n=9423). Solid curve represents restricted cubic splines; dashed curve represents segmented linear splines; shaded area represents the 95% confidence interval of restricted cubic splines.

