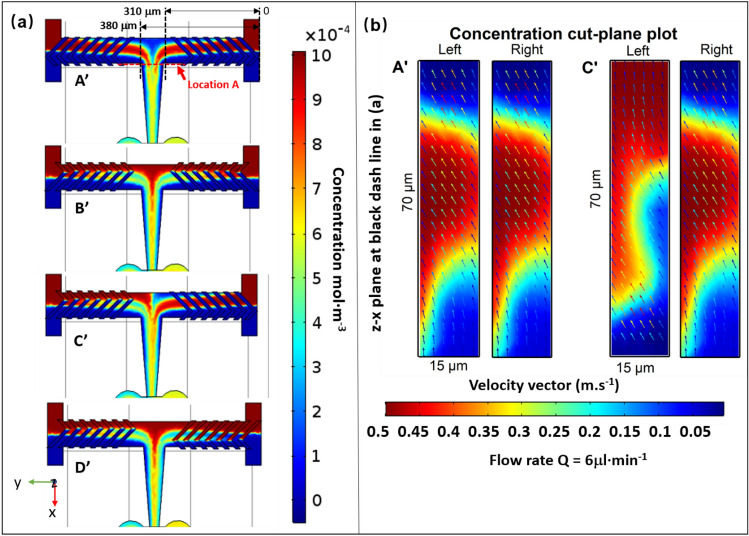
Figure 3.
Simulation results along the mixing channel of four SHB designs A’, B’ C’ D’. (a) shows the concentration profiles in the x–y plane at z = 7.5 µm (middle of the channel), the two black dashed lines indicate the locations at the end of premixing after passing through half cycle of the grooves on each side (distance of 310 µm and 380 µm from the entrance at the right), while the red dashed line indicates the location where the combined solutions change the flow direction to x. (b) is the slice concentration profile projected onto x–z plane located at the black dashed lines at 310 and 380 µm from the right channel labelled as “left” and “right”, respectively. The concentration profile shares the same color bar with (a). Velocity vectors were plotted as colored arrows with the color bar representing the velocity (m·s−1). The simulations were performed with the COMSOL Multiphyics software (http://www.comsol.com).

