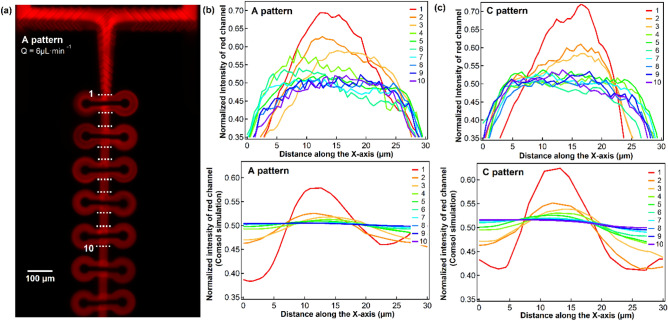
Figure 6.
Mixing of an aqueous solution of Rhodamine B-dextran 70 kDa with distilled water. (a) fluorescence image of design A, performed with the same parameters as in Fig. 4, (b) the experimental Dextran-Rhodamine B conjugate concentration profiles across the channel at the indicated location in (a) (dash line) compared to the COMSOL simulation results at the same location. The same experimental concentration profiles and simulation results for pattern C were plotted accordingly in (c).

