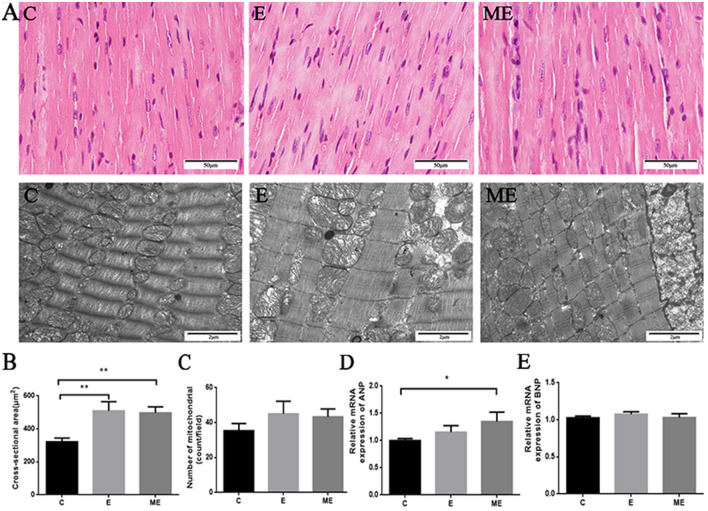
Figure 2.
The effects of MOTS-c and exercise training on rat myocardial structure and hypertrophic genes. (A) is the HE staining (× 400) and TEM (× 20,000) images of the myocardium, which respectively reflect the gross and ultrastructure of the myocardium. The arrow is the lysosome. (B) Quantification of cross-sectional area of cardiomyocytes from H&E-stained sections. (C) Quantitative analysis of the number of myocardial mitochondria in TEM. (D and E) The mRNA expression of ANP and BNP. *p < 0.05, **p < 0.01, compared to group C. C = Control, E = Exercise training, ME = Exercise training combined with MOTS-c treatment.

