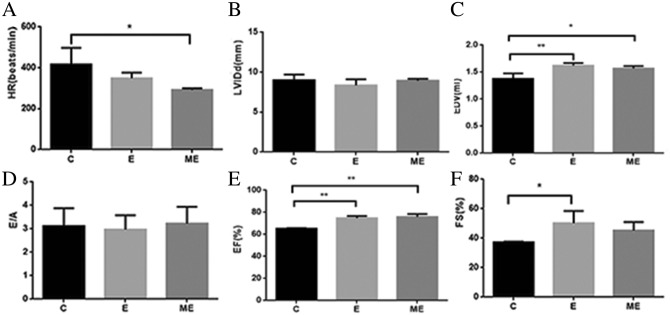
Figure 3.
Changes of cardiac structure and function after MOTS-c. (A) The HR in group ME was lower than in group C. (B) There were no differences in LVIDd among these three groups; (C) The EDV in group E and ME was higher than in group C; (D)There were no differences in E/A among these three groups; (E) The EF in group E and ME was significantly higher than in group C; (F) The FS in group E was higher than in group C. *p < 0.05, **p < 0.01, compared to group C. #p < 0.05, compared to group E.

