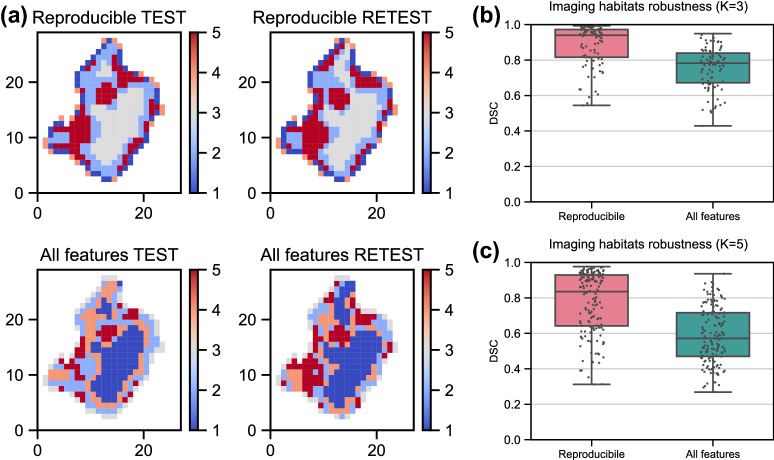
Figure 4.
Robustness of imaging habitats to feature selection. (a) Axial section of imaging habitats computed using selected features (repeatable and reproducible; upper figures) and using all features (lower figures) in patient’s test and retest CTs. Five imaging habitats were computed in each case (see color bar). (b,c) Robustness of imaging habitats quantified using Dice Similarity Coefficient (DSC) between habitats computed in test and retest images of all 30 lung cancer patients. Different numbers of habitats per lesion were evaluated; K = 3 and K = 5. Observations are shown on top of a boxplot.

