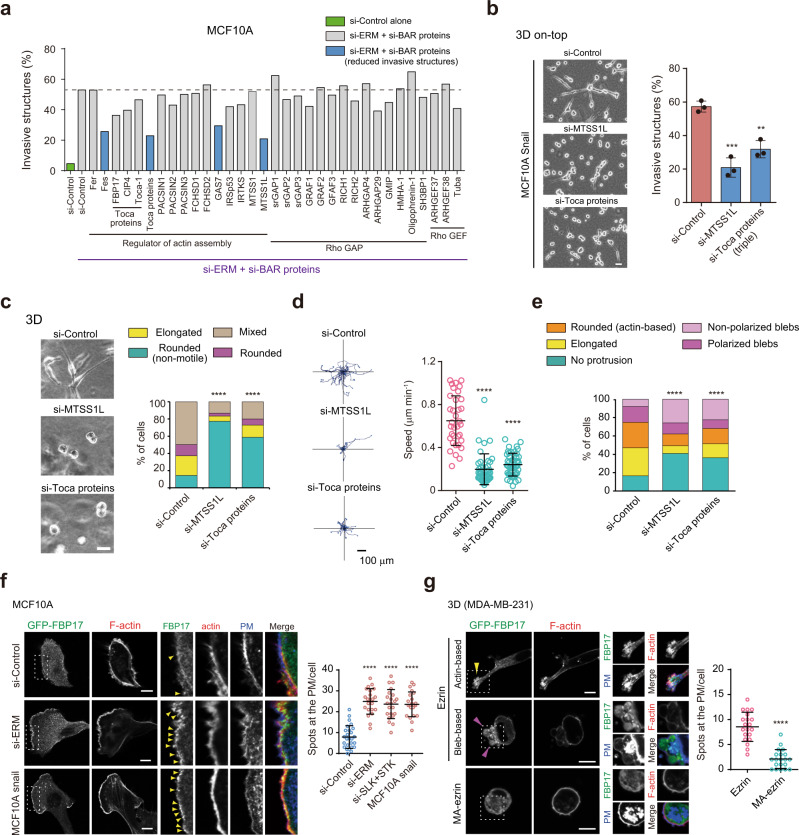
Fig. 5. Homeostatic PM tension suppresses cancer cell migration by counteracting BAR proteins.
a Fraction of MCF10A spheroids with invasive structures grown in 3D on-top culture treated with the indicated RNAi. Control siRNA alone and siRNAs targeting BAR proteins that reduce invasive structures induced by ERM deletion are shown in green and blue, respectively. Data are mean of two independent experiments with at least 50 cells per experiment. b Left, representative images of the indicated cells in 3D on-top culture. Right, fraction of the invasive structures of the indicated cells. Data are mean ± SD of three independent experiments with at least 200 cells per experiment. Scale bar, 20 µm. **P = 0.002; ***P = 0.0007. c Phase-contrast images of MDA-MB-231 cells treated with the indicated RNAi in 3D. Scale bar, 20 µm. Right, quantification of 3D migration phenotypes of n = 153 (si-Control), n = 150 (si-MTSS1L), and n = 155 (si-Toca proteins) cells from three independent experiments. d Trajectories of cell centroids of the indicated cells tracked in c for 8 h. Right, the average speed of one cell over the course of 8 h. n = 35 (si-Control), n = 43 (si-MTSS1L), and n = 46 (si-Toca proteins) cells pooled from three independent experiments. Mean ± SD. e Quantification of protrusions of the indicated cells in 3D. n = 151 (si-Control), n = 132 (si-MTSS1L), and n = 138 (si-Toca proteins) from three independent experiments (see also Supplementary Fig. 5e). f Confocal images of the indicated cells expressing GFP-FBP17 stained with phalloidin and WGA. Yellow arrowheads indicate GFP-FBP17 spots at the PM. Scale bars, 10 µm. Right, quantification of GFP-FBP17 puncta of n = 26 (si-Control), n = 22 (si-ERM), n = 22 (si-SLK+STK10), and n = 22 (Snail-expressing cells) cells pooled from three independent experiments. g Confocal images of the indicated cells stained with phalloidin and WGA in 3D. Yellow and magenta arrowheads indicate FBP17 accumulation at actin- and bleb-based protrusions, respectively. Scale bars, 10 µm. Right, quantification of GFP-FBP17 puncta of n = 20 (ezrin) and n = 20 (MA-ezrin) cells pooled from three independent experiments. All data, except for a, were expressed as mean ± SD. Significance tested using the two-tailed Student’s t-test (b, f, g), two-tailed Mann–Whitney test (d), and chi-square test (c, e). ****P < 0.0001.

