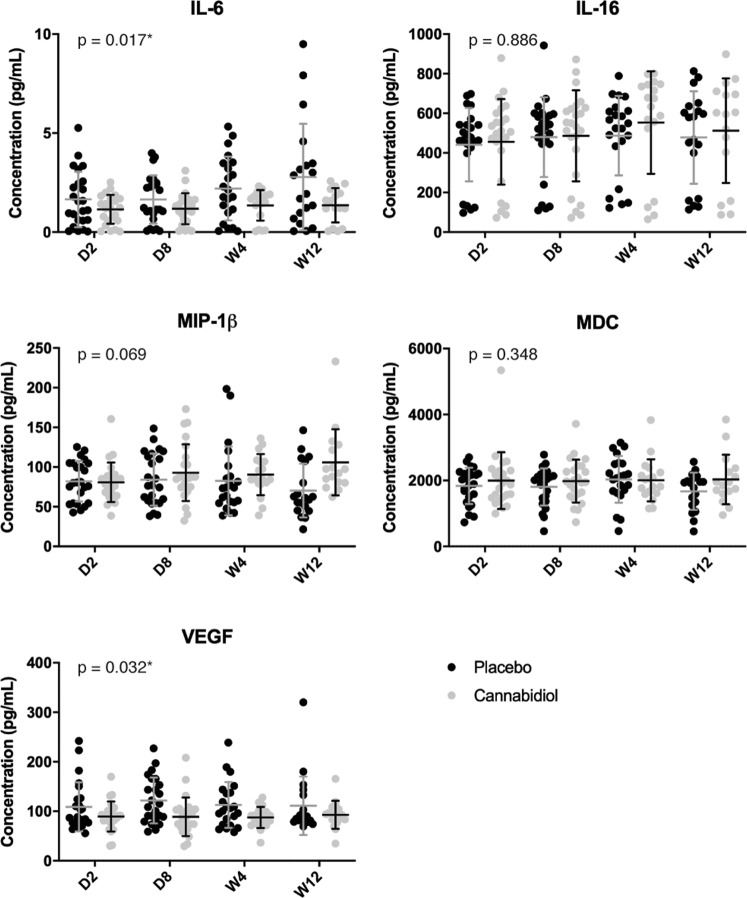
Fig. 2. Cytokines profile of the cannabidiol group compared with the placebo group at baseline (day 2), day 8, week 4, and week 12.
Individual concentrations of interleukin-6 (IL-6), interleurkin-16 (IL-16), macrophage inflammatory protein-1β (MIP-1β), macrophage-derived chemokine (MDC), and vascular endothelial growth factor-A (VEGF-A) are presented in column scatter plots. The mean and standard deviation (SD) are expressed with horizontal and vertical bars, respectively. *Indicates p value < 0.05. D day, W week.

