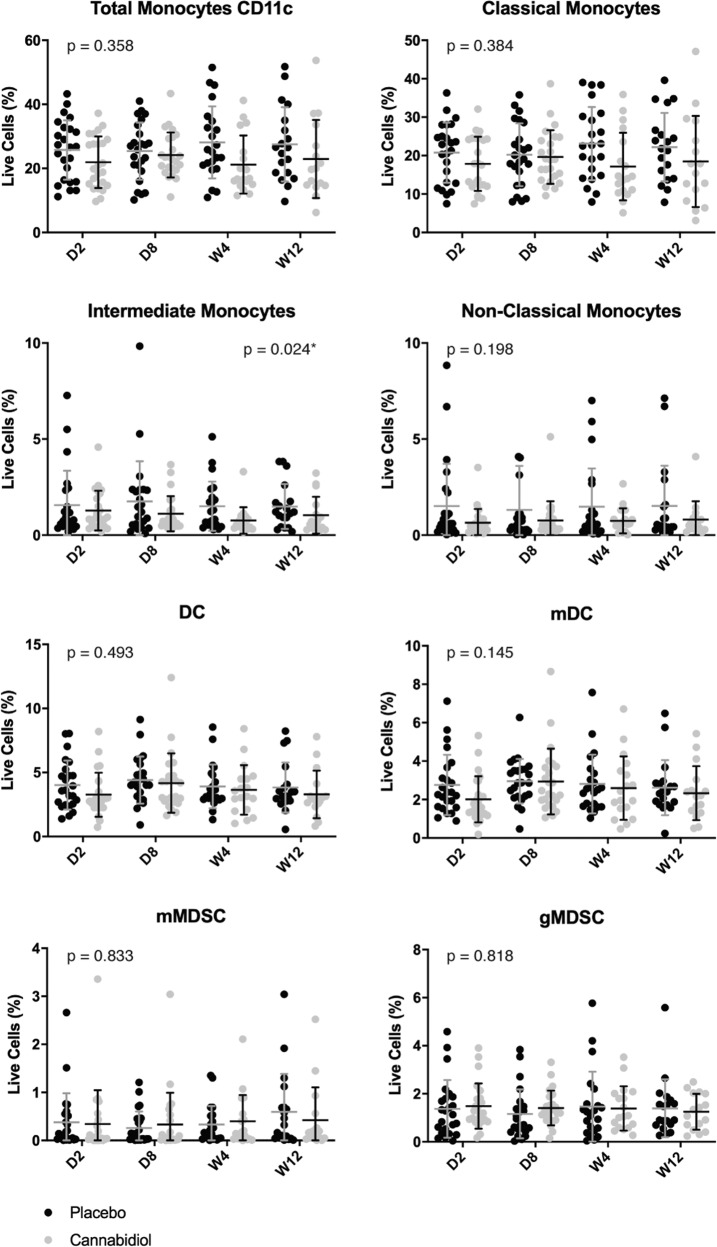
Fig. 3. Monocytes profile of the cannabidiol group compared with the placebo group at baseline (day 2), day 8, week 4, and week 12.
Individual percentages of total CD11c+ monocytes, classical monocytes (CD14+CD16−), intermediate monocytes (CD14+CD16+), nonclassical monocytes (CD14loCD16+), dendritic cells (DC), myeloid dendritic cells (mDC), monocytic myeloid-derived suppressor cells (mMDSC), granulocytic myeloid-derived suppressor cells (gMDSC) are presented in column scatter plots. The mean and standard deviation (SD) are expressed with horizontal and vertical bars, respectively. *Indicates p value < 0.05. CD cluster of differentiation, D day, W week.

