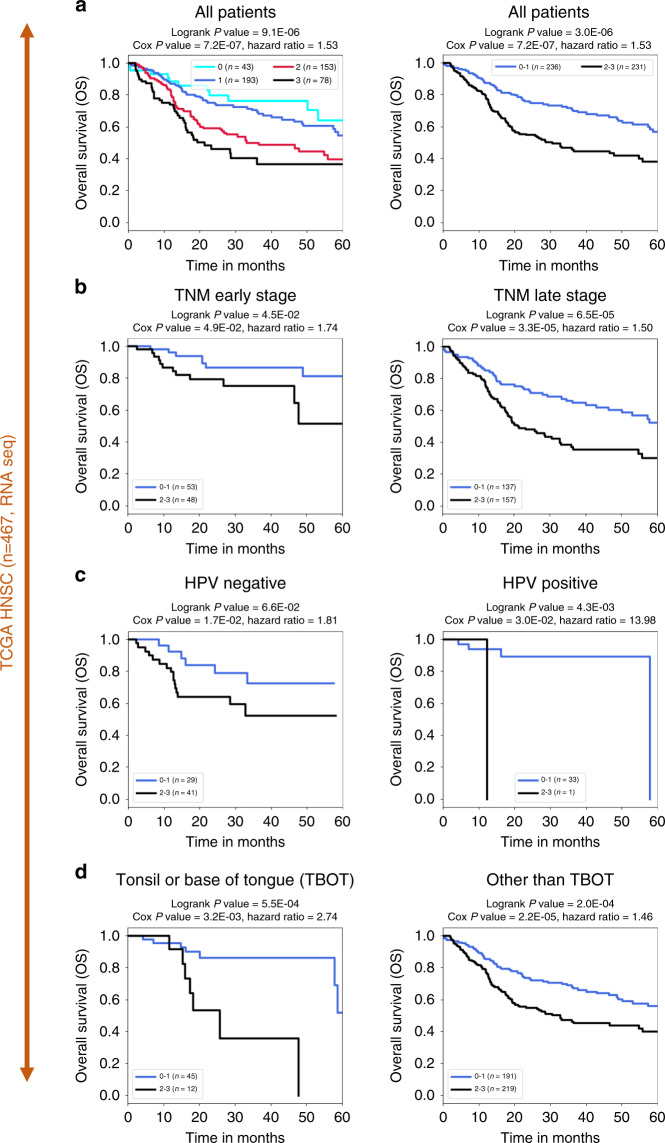
Fig. 2. Stratification of the TCGA-HNSC patients using the 3-genes signature in the validation dataset (n = 467, RNAseq).
Kaplan–Meier survival curves illustrating TCGA-HNSC patients’ overall survival (OS) according to the number of activations of the three genes (AREG, CCNA1 and DDX20), considering all patients (n = 467) (a) or subsets of patients defined according to clinical and biological parameters (b, c or d) including TNM early or late stages (b), human papillomavirus (HPV) status (c) or tumour localisation (d). a All patients: in the left panel, the patients are grouped according to the total number of gene activations, and in the right panel survival probabilities are compared between patients with tumours activating none or one gene (0–1) or 2 or 3 of the three genes (2–3). b–d Kaplan–Meier survival curves illustrating TCGA-HNSC patients’ overall survival (OS) according to our 3-gene classifier when applied to the following subsets of patients. b Survival probabilities of subsets of patients at an early TNM stage ((T1 or T2) and (N0 or N1), left panel) or TNM late-stage ((T3 or more) or (N2 or more), right panel). c Survival probabilities of subsets of HPV-negative patients (left panel) or HPV-positive patients (right panel, note that only one HPV-positive patient is negative for our 3-gene classifier and P values and hazard ratio are not statistically relevant in this case). d Survival probabilities of subsets of patients with tonsil or base of tongue localisation (TBOT: left panel) or other localisation (other than TBOT: right panel).

