Figure 6.
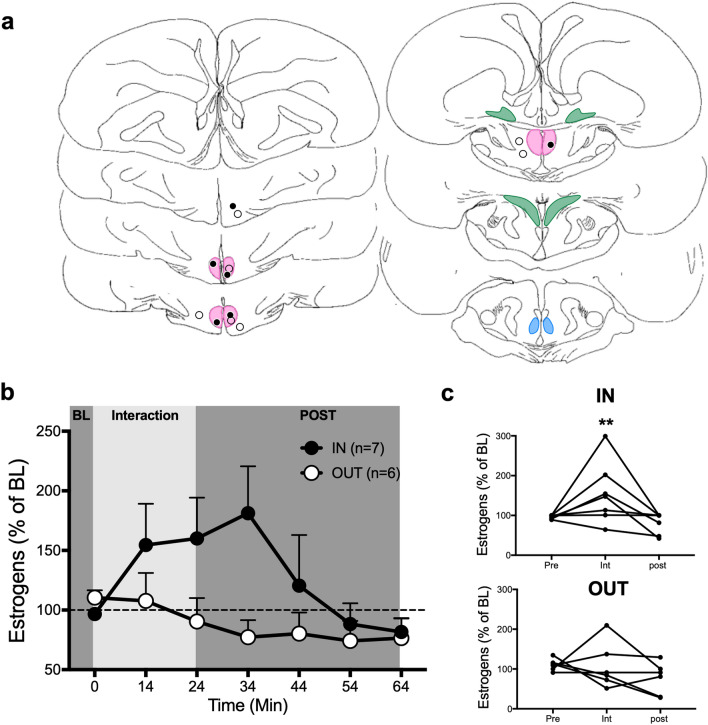
Changes in local estrogen concentration are detected within 10 min of sexual interaction in medial preoptic nucleus (POM) but not outside. (a) Schematic representation of coronal sections of the quail brain showing the location of the dialysis probes. IN probes are either within or touching the colored zones representing brain regions expressing aromatase. See legend of Fig. 1 for the definition of different brain areas. Black and open circles respectively represent birds in which estrogen concentrations did or did not increase above 150% of the baseline (BL) during the interaction period. (b) Mean time course of changes of estrogen concentration in the dialysate during the course of the experiment expressed as the percentage of estrogen change based on the mean concentration measured in the last 3 BL samples. BL represents the last point of the 60 min baseline period during which samples were collected every 10 min. IN: Birds with the probe in POM, OUT: Birds with the probe outside any aromatase expressing cell populations. POST: post-interaction period. Friedman ANOVA: IN, χ2n=7 = 19.58, p = 0.0033; OUT: χ2n=7 = 5.837, p = 0.4417. No post hoc comparison reached significance. (c) Individual percent changes in estrogen concentration relative to BL in the three sampling periods for animals whose probe was within or outside POM. Friedman ANOVA (POM: χ2n=7 = 6.348, p = 0.0501; OUT: χ2n=6 = 0.9774, p = 0.6559; post hoc : **p < 0.01 vs POST). The baseline amounts of estrogens per sample in this experiment ranged between 0.053 and 0.315 pg per sample (10 µl; Mean ± S.E.M. = 0.147 ± 0.024, n = 13). Panel (a) is composed of home made drawings onto which probe positions were reported using Graphic for Mac (https://graphic.com/mac/), other panels were created with Graph Pad Prism 8 (https://www.graphpad.com/scientific-software/prism/). All panels were assembled in Graphic.

