Figure 1.
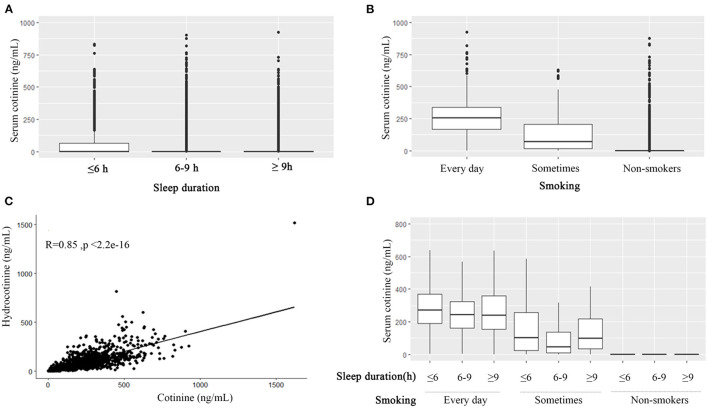
The association among smoking, cotinine, hydrocotinine, and sleep duration. Boxplots of serum cotinine levels grouped by sleep duration (≤ 6, 6–9, and ≥9 h) (A), grouped by smoking frequency (B), and grouped by sleep duration and smoking frequency (D). (C)The scatter plot of cotinine and hydrocotinine with the Pearson correlation r = 0.85.

