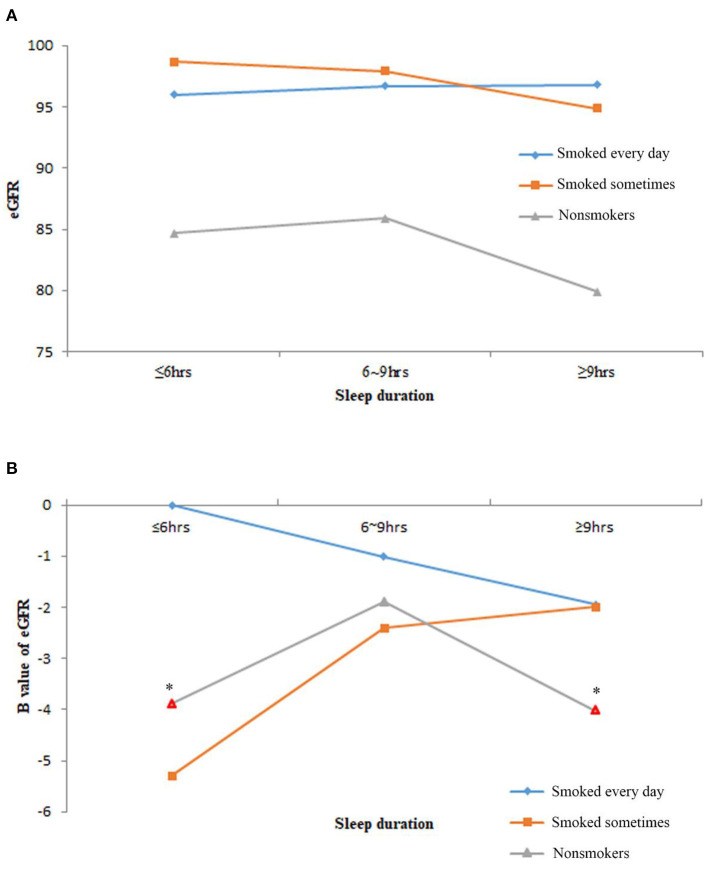
Figure 2.
The estimated glomerular filtration rate (eGFR) levels of the nine subgroups of study population by sleep duration and smoking frequency. (A) The average eGFR levels of nine subgroups. (B) The B value of eGFR in multivariable linear regression models after adjusting age, race, body mass index (BMI), marital status, frequency of snoring or breath cessation, diabetes, high blood pressure, high cholesterol, anemia, congestive heart failure, coronary heart disease and stroke. Marks in red border and asterisks denoted p < 0.05 in the multivariable linear regression models.

